29
/pt/
pt
AIzaSyAYiBZKx7MnpbEhh9jyipgxe19OcubqV5w
April 1, 2024
124301
Ecuador
ECU
true
2
1
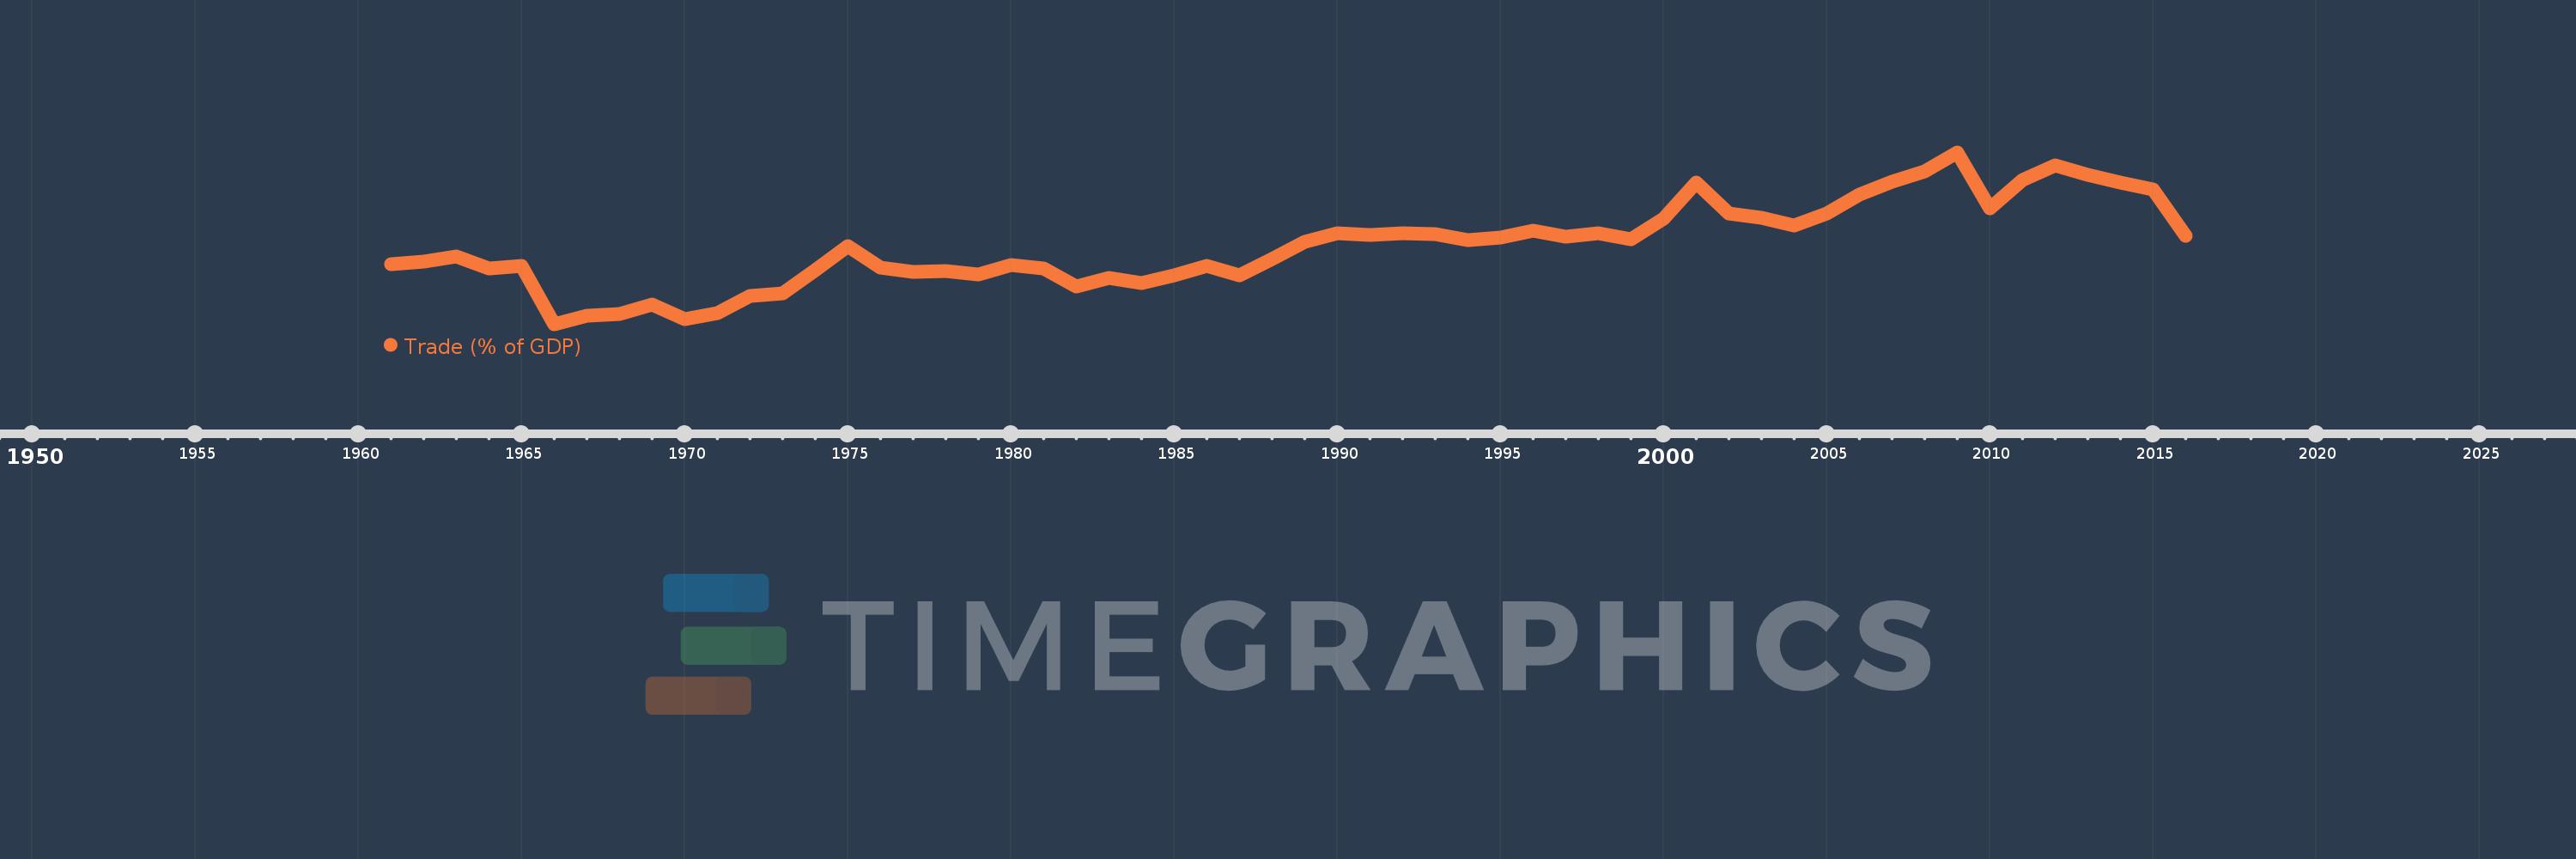
Trade (% of GDP)
2016,2015,2014,2013,2012,2011,2010,2009,2008,2007,2006,2005,2004,2003,2002,2001,2000,1999,1998,1997,1996,1995,1994,1993,1992,1991,1990,1989,1988,1987,1986,1985,1984,1983,1982,1981,1980,1979,1978,1977,1976,1975,1974,1973,1972,1971,1970,1969,1968,1967,1966,1965,1964,1963,1962,1961
Estas estatísticas em outros países:
AfghanistanAlbaniaAlgeriaAngolaAntigua and BarbudaArab WorldArgentinaArmeniaArubaAustraliaAustriaAzerbaijanBahamas, TheBahrainBangladeshBarbadosBelarusBelgiumBelizeBeninBermudaBhutanBoliviaBosnia and HerzegovinaBotswanaBrazilBrunei DarussalamBulgariaBurkina FasoBurundiCabo VerdeCambodiaCameroonCanadaCaribbean small statesCentral African RepublicCentral Europe and the BalticsChadChileChinaColombiaComorosCongo, Dem. Rep.Congo, Rep.Costa RicaCote d'IvoireCroatiaCubaCyprusCzech RepublicDenmarkDjiboutiDominicaDominican RepublicEarly-demographic dividendEast Asia & PacificEast Asia & Pacific (excluding high income)East Asia & Pacific (IDA & IBRD countries)EcuadorEgypt, Arab Rep.El SalvadorEquatorial GuineaEritreaEstoniaEthiopiaEuro areaEurope & Central AsiaEurope & Central Asia (excluding high income)Europe & Central Asia (IDA & IBRD countries)European UnionFaroe IslandsFijiFinlandFragile and conflict affected situationsFranceFrench PolynesiaGabonGambia, TheGeorgiaGermanyGhanaGreeceGrenadaGuatemalaGuineaGuinea-BissauGuyanaHaitiHeavily indebted poor countries (HIPC)High incomeHondurasHong Kong SAR, ChinaHungaryIBRD onlyIcelandIDA & IBRD totalIDA blendIDA onlyIDA totalIndiaIndonesiaIran, Islamic Rep.IraqIrelandIsraelItalyJamaicaJapanJordanKazakhstanKenyaKiribatiKorea, Rep.KosovoKuwaitKyrgyz RepublicLao PDRLate-demographic dividendLatin America & Caribbean Latin America & Caribbean (excluding high income)Latin America & the Caribbean (IDA & IBRD countries)LatviaLeast developed countries: UN classificationLebanonLesothoLiberiaLibyaLithuaniaLow & middle incomeLow incomeLower middle incomeLuxembourgMacao SAR, ChinaMacedonia, FYRMadagascarMalawiMalaysiaMaldivesMaliMaltaMauritaniaMauritiusMexicoMicronesia, Fed. Sts.Middle East & North AfricaMiddle East & North Africa (excluding high income)Middle East & North Africa (IDA & IBRD countries)Middle incomeMoldovaMongoliaMontenegroMoroccoMozambiqueMyanmarNamibiaNepalNetherlandsNew CaledoniaNew ZealandNicaraguaNigerNigeriaNorth AmericaNorwayOECD membersOmanOther small statesPacific island small statesPakistanPalauPanamaPapua New GuineaParaguayPeruPhilippinesPolandPortugalPost-demographic dividendPre-demographic dividendPuerto RicoQatarRomaniaRussian FederationRwandaSamoaSaudi ArabiaSenegalSerbiaSeychellesSierra LeoneSingaporeSlovak RepublicSloveniaSmall statesSolomon IslandsSomaliaSouth AfricaSouth AsiaSouth Asia (IDA & IBRD)South SudanSpainSri LankaSt. Kitts and NevisSt. LuciaSt. Vincent and the GrenadinesSub-Saharan Africa Sub-Saharan Africa (excluding high income)Sub-Saharan Africa (IDA & IBRD countries)SudanSurinameSwazilandSwedenSwitzerlandSyrian Arab RepublicTajikistanTanzaniaThailandTimor-LesteTogoTongaTrinidad and TobagoTunisiaTurkeyTurkmenistanUgandaUkraineUnited Arab EmiratesUnited KingdomUnited StatesUpper middle incomeUruguayUzbekistanVanuatuVenezuela, RBVietnamWest Bank and GazaWorldYemen, Rep.ZambiaZimbabwe Linha do tempo:
Nesta escala de tempo está apresentado um gráfico de 1961 ano até 2016 ano Ecuador. Dados de 1960 ano ausente. O número de observações reais por data: 56.
Fonte (nome):
Indicadores de desenvolvimento mundial
Fonte (organização):
World Bank national accounts data, and OECD National Accounts data files.
Categorias:
Economy & Growth, Trade
Foi atualizado:
23 abr 2017 ano
Indicadores de alterações dos valores ao longo dos anos
Mínimo:
19.27
1 jan 1966 ano
Máximo:
68.057
1 jan 2009 ano
Na data de observação
Valor
Mudança absoluta
A alteração em relação ao valor anterior
1 jan 1961 ano
36.34
+36.34
0.0%
1 jan 1962 ano
36.947
+0.607
1.67%
1 jan 1963 ano
38.444
+1.496
4.05%
1 jan 1964 ano
35.156
-3.288
-8.55%
1 jan 1965 ano
35.721
+0.565
1.61%
1 jan 1966 ano
19.27
-16.45
-46.05%
1 jan 1967 ano
21.6
+2.33
12.09%
1 jan 1968 ano
22.139
+0.539
2.49%
1 jan 1969 ano
24.96
+2.822
12.75%
1 jan 1970 ano
20.605
-4.355
-17.45%
1 jan 1971 ano
22.451
+1.846
8.96%
1 jan 1972 ano
27.271
+4.819
21.47%
1 jan 1973 ano
27.958
+0.687
2.52%
1 jan 1974 ano
34.538
+6.58
23.53%
1 jan 1975 ano
41.404
+6.867
19.88%
1 jan 1976 ano
35.405
-5.999
-14.49%
1 jan 1977 ano
34.014
-1.391
-3.93%
1 jan 1978 ano
34.442
+0.428
1.26%
1 jan 1979 ano
33.296
-1.146
-3.33%
1 jan 1980 ano
36.08
+2.784
8.36%
1 jan 1981 ano
35.025
-1.055
-2.92%
1 jan 1982 ano
29.915
-5.11
-14.59%
1 jan 1983 ano
32.413
+2.498
8.35%
1 jan 1984 ano
30.876
-1.537
-4.74%
1 jan 1985 ano
33.058
+2.182
7.07%
1 jan 1986 ano
35.717
+2.659
8.04%
1 jan 1987 ano
33.111
-2.607
-7.3%
1 jan 1988 ano
37.731
+4.62
13.95%
1 jan 1989 ano
42.662
+4.932
13.07%
1 jan 1990 ano
45.113
+2.451
5.74%
1 jan 1991 ano
44.595
-0.518
-1.15%
1 jan 1992 ano
45.197
+0.602
1.35%
1 jan 1993 ano
44.807
-0.39
-0.86%
1 jan 1994 ano
43.171
-1.635
-3.65%
1 jan 1995 ano
43.778
+0.607
1.4%
1 jan 1996 ano
45.911
+2.134
4.87%
1 jan 1997 ano
44.216
-1.696
-3.69%
1 jan 1998 ano
45.017
+0.801
1.81%
1 jan 1999 ano
43.395
-1.622
-3.6%
1 jan 2000 ano
49.201
+5.806
13.38%
1 jan 2001 ano
59.465
+10.263
20.86%
1 jan 2002 ano
50.745
-8.72
-14.66%
1 jan 2003 ano
49.377
-1.369
-2.7%
1 jan 2004 ano
47.242
-2.135
-4.32%
1 jan 2005 ano
50.665
+3.424
7.25%
1 jan 2006 ano
56.1
+5.435
10.73%
1 jan 2007 ano
59.71
+3.61
6.43%
1 jan 2008 ano
62.587
+2.877
4.82%
1 jan 2009 ano
68.057
+5.47
8.74%
1 jan 2010 ano
52.105
-15.952
-23.44%
1 jan 2011 ano
60.303
+8.198
15.73%
1 jan 2012 ano
64.49
+4.187
6.94%
1 jan 2013 ano
61.751
-2.739
-4.25%
1 jan 2014 ano
59.606
-2.145
-3.47%
1 jan 2015 ano
57.489
-2.117
-3.55%
1 jan 2016 ano
44.334
-13.155
-22.88%
Classificação de países por estatísticas atuais por anos


Comentários: