29
/pt/
pt
AIzaSyAYiBZKx7MnpbEhh9jyipgxe19OcubqV5w
April 1, 2024
57755
South Asia
SAS
false
2
1
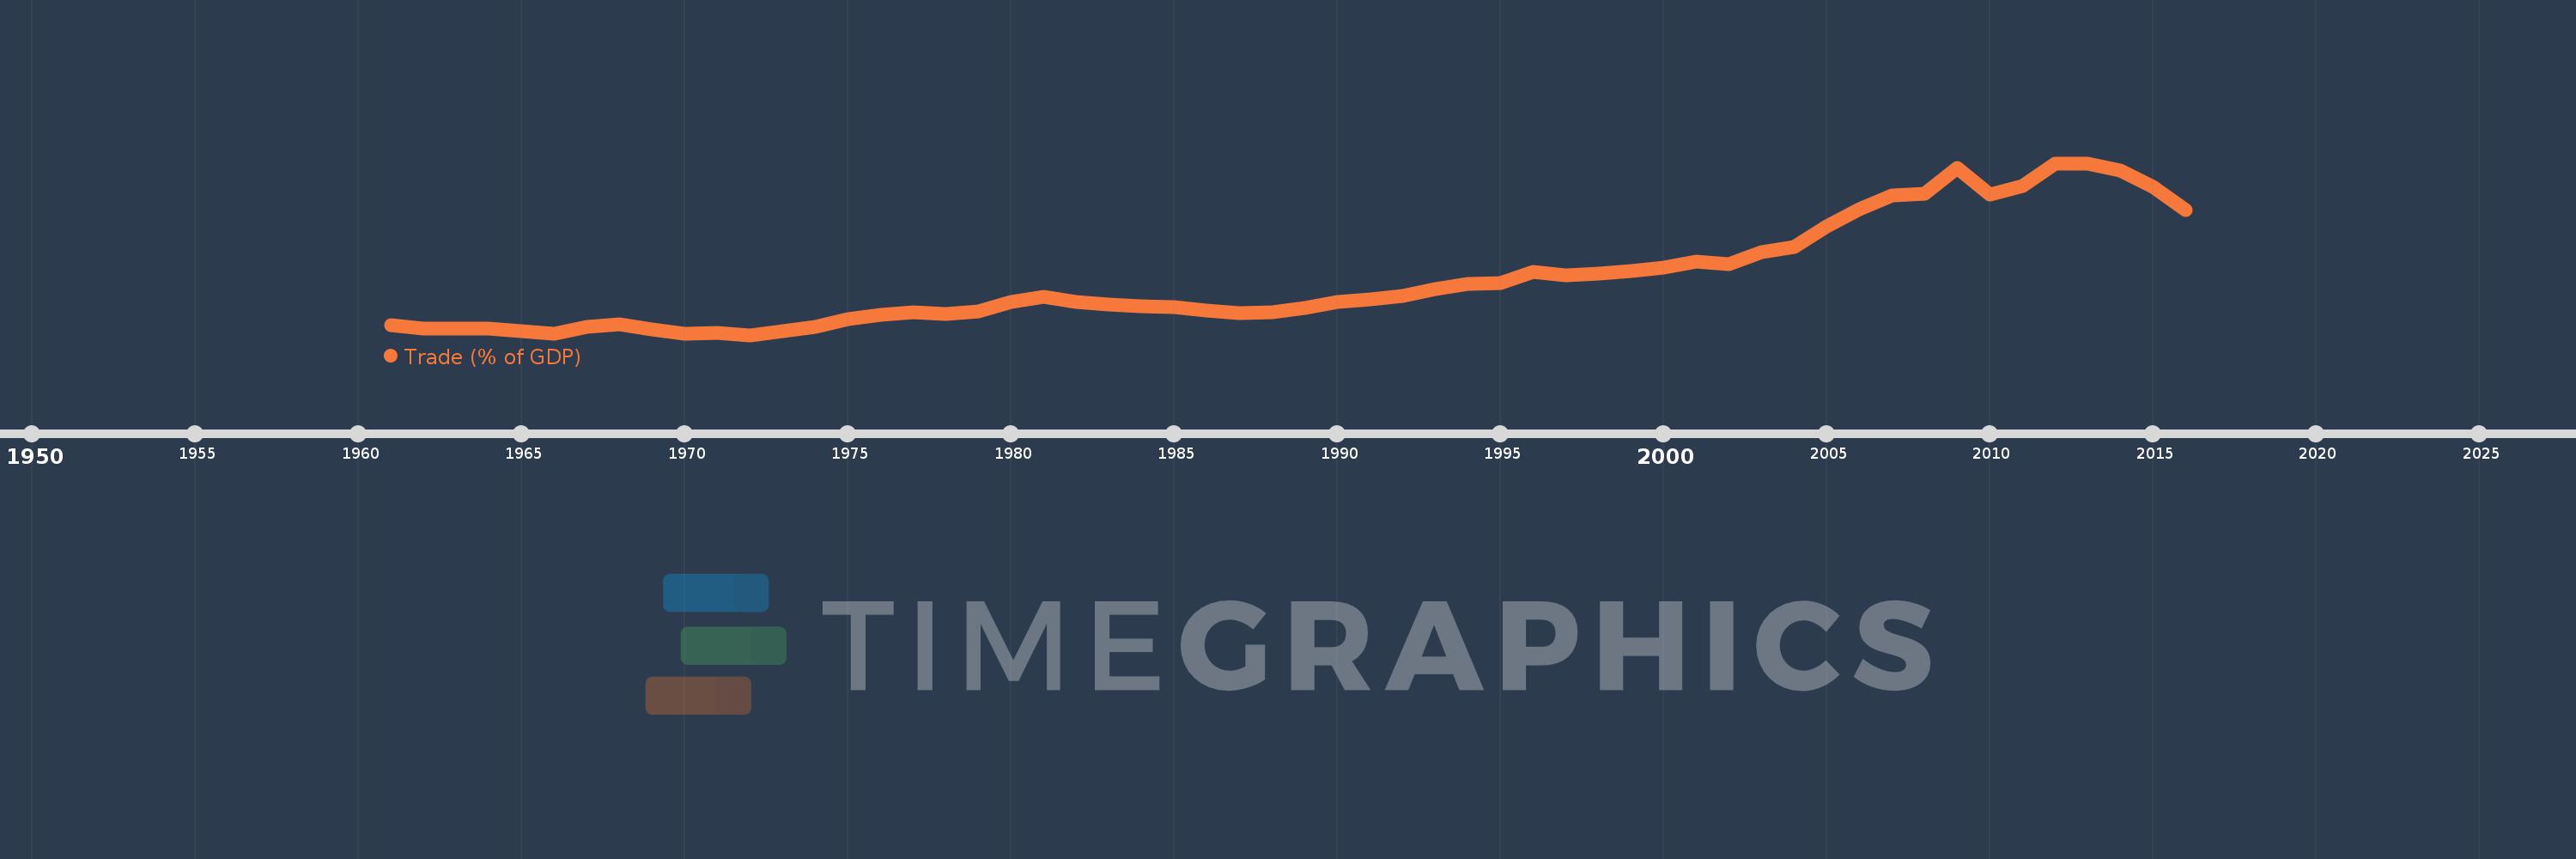
Trade (% of GDP)
2016,2015,2014,2013,2012,2011,2010,2009,2008,2007,2006,2005,2004,2003,2002,2001,2000,1999,1998,1997,1996,1995,1994,1993,1992,1991,1990,1989,1988,1987,1986,1985,1984,1983,1982,1981,1980,1979,1978,1977,1976,1975,1974,1973,1972,1971,1970,1969,1968,1967,1966,1965,1964,1963,1962,1961
Estas estatísticas em outros países:
AfghanistanAlbaniaAlgeriaAngolaAntigua and BarbudaArab WorldArgentinaArmeniaArubaAustraliaAustriaAzerbaijanBahamas, TheBahrainBangladeshBarbadosBelarusBelgiumBelizeBeninBermudaBhutanBoliviaBosnia and HerzegovinaBotswanaBrazilBrunei DarussalamBulgariaBurkina FasoBurundiCabo VerdeCambodiaCameroonCanadaCaribbean small statesCentral African RepublicCentral Europe and the BalticsChadChileChinaColombiaComorosCongo, Dem. Rep.Congo, Rep.Costa RicaCote d'IvoireCroatiaCubaCyprusCzech RepublicDenmarkDjiboutiDominicaDominican RepublicEarly-demographic dividendEast Asia & PacificEast Asia & Pacific (excluding high income)East Asia & Pacific (IDA & IBRD countries)EcuadorEgypt, Arab Rep.El SalvadorEquatorial GuineaEritreaEstoniaEthiopiaEuro areaEurope & Central AsiaEurope & Central Asia (excluding high income)Europe & Central Asia (IDA & IBRD countries)European UnionFaroe IslandsFijiFinlandFragile and conflict affected situationsFranceFrench PolynesiaGabonGambia, TheGeorgiaGermanyGhanaGreeceGrenadaGuatemalaGuineaGuinea-BissauGuyanaHaitiHeavily indebted poor countries (HIPC)High incomeHondurasHong Kong SAR, ChinaHungaryIBRD onlyIcelandIDA & IBRD totalIDA blendIDA onlyIDA totalIndiaIndonesiaIran, Islamic Rep.IraqIrelandIsraelItalyJamaicaJapanJordanKazakhstanKenyaKiribatiKorea, Rep.KosovoKuwaitKyrgyz RepublicLao PDRLate-demographic dividendLatin America & Caribbean Latin America & Caribbean (excluding high income)Latin America & the Caribbean (IDA & IBRD countries)LatviaLeast developed countries: UN classificationLebanonLesothoLiberiaLibyaLithuaniaLow & middle incomeLow incomeLower middle incomeLuxembourgMacao SAR, ChinaMacedonia, FYRMadagascarMalawiMalaysiaMaldivesMaliMaltaMauritaniaMauritiusMexicoMicronesia, Fed. Sts.Middle East & North AfricaMiddle East & North Africa (excluding high income)Middle East & North Africa (IDA & IBRD countries)Middle incomeMoldovaMongoliaMontenegroMoroccoMozambiqueMyanmarNamibiaNepalNetherlandsNew CaledoniaNew ZealandNicaraguaNigerNigeriaNorth AmericaNorwayOECD membersOmanOther small statesPacific island small statesPakistanPalauPanamaPapua New GuineaParaguayPeruPhilippinesPolandPortugalPost-demographic dividendPre-demographic dividendPuerto RicoQatarRomaniaRussian FederationRwandaSamoaSaudi ArabiaSenegalSerbiaSeychellesSierra LeoneSingaporeSlovak RepublicSloveniaSmall statesSolomon IslandsSomaliaSouth AfricaSouth AsiaSouth Asia (IDA & IBRD)South SudanSpainSri LankaSt. Kitts and NevisSt. LuciaSt. Vincent and the GrenadinesSub-Saharan Africa Sub-Saharan Africa (excluding high income)Sub-Saharan Africa (IDA & IBRD countries)SudanSurinameSwazilandSwedenSwitzerlandSyrian Arab RepublicTajikistanTanzaniaThailandTimor-LesteTogoTongaTrinidad and TobagoTunisiaTurkeyTurkmenistanUgandaUkraineUnited Arab EmiratesUnited KingdomUnited StatesUpper middle incomeUruguayUzbekistanVanuatuVenezuela, RBVietnamWest Bank and GazaWorldYemen, Rep.ZambiaZimbabwe Linha do tempo:
Nesta escala de tempo está apresentado um gráfico de 1961 ano até 2016 ano South Asia. Dados de 1960 ano ausente. O número de observações reais por data: 56.
Fonte (nome):
Indicadores de desenvolvimento mundial
Fonte (organização):
World Bank national accounts data, and OECD National Accounts data files.
Categorias:
Economy & Growth, Trade
Foi atualizado:
23 abr 2017 ano
Indicadores de alterações dos valores ao longo dos anos
Mínimo:
10.595
1 jan 1972 ano
Máximo:
53.004
1 jan 2012 ano
Na data de observação
Valor
Mudança absoluta
A alteração em relação ao valor anterior
1 jan 1961 ano
13.115
+13.115
0.0%
1 jan 1962 ano
12.24
-0.876
-6.68%
1 jan 1963 ano
12.165
-0.075
-0.61%
1 jan 1964 ano
12.151
-0.013
-0.11%
1 jan 1965 ano
11.593
-0.559
-4.6%
1 jan 1966 ano
10.872
-0.721
-6.22%
1 jan 1967 ano
12.674
+1.802
16.57%
1 jan 1968 ano
13.18
+0.506
3.99%
1 jan 1969 ano
11.99
-1.19
-9.03%
1 jan 1970 ano
10.871
-1.119
-9.33%
1 jan 1971 ano
11.081
+0.211
1.94%
1 jan 1972 ano
10.595
-0.486
-4.39%
1 jan 1973 ano
11.543
+0.948
8.95%
1 jan 1974 ano
12.608
+1.064
9.22%
1 jan 1975 ano
14.562
+1.955
15.5%
1 jan 1976 ano
15.486
+0.923
6.34%
1 jan 1977 ano
16.26
+0.775
5.0%
1 jan 1978 ano
15.875
-0.386
-2.37%
1 jan 1979 ano
16.366
+0.491
3.1%
1 jan 1980 ano
18.653
+2.287
13.98%
1 jan 1981 ano
19.996
+1.343
7.2%
1 jan 1982 ano
18.714
-1.282
-6.41%
1 jan 1983 ano
18.025
-0.689
-3.68%
1 jan 1984 ano
17.767
-0.258
-1.43%
1 jan 1985 ano
17.434
-0.333
-1.87%
1 jan 1986 ano
16.597
-0.837
-4.8%
1 jan 1987 ano
15.981
-0.616
-3.71%
1 jan 1988 ano
16.283
+0.302
1.89%
1 jan 1989 ano
17.231
+0.947
5.82%
1 jan 1990 ano
18.663
+1.433
8.32%
1 jan 1991 ano
19.392
+0.729
3.91%
1 jan 1992 ano
20.248
+0.856
4.41%
1 jan 1993 ano
21.882
+1.634
8.07%
1 jan 1994 ano
23.256
+1.374
6.28%
1 jan 1995 ano
23.34
+0.084
0.36%
1 jan 1996 ano
26.107
+2.767
11.86%
1 jan 1997 ano
25.359
-0.748
-2.87%
1 jan 1998 ano
25.861
+0.502
1.98%
1 jan 1999 ano
26.444
+0.583
2.26%
1 jan 2000 ano
27.177
+0.733
2.77%
1 jan 2001 ano
28.755
+1.578
5.81%
1 jan 2002 ano
28.16
-0.594
-2.07%
1 jan 2003 ano
31.082
+2.922
10.38%
1 jan 2004 ano
32.339
+1.256
4.04%
1 jan 2005 ano
37.515
+5.176
16.01%
1 jan 2006 ano
41.741
+4.226
11.26%
1 jan 2007 ano
45.148
+3.408
8.16%
1 jan 2008 ano
45.487
+0.339
0.75%
1 jan 2009 ano
51.866
+6.379
14.02%
1 jan 2010 ano
45.259
-6.607
-12.74%
1 jan 2011 ano
47.454
+2.195
4.85%
1 jan 2012 ano
53.004
+5.55
11.7%
1 jan 2013 ano
52.991
-0.013
-0.02%
1 jan 2014 ano
51.294
-1.697
-3.2%
1 jan 2015 ano
47.104
-4.19
-8.17%
1 jan 2016 ano
41.497
-5.607
-11.9%
Classificação de países por estatísticas atuais por anos


Comentários: