29
/pt/
pt
AIzaSyAYiBZKx7MnpbEhh9jyipgxe19OcubqV5w
April 1, 2024
219164
Panama
PAN
true
2
1
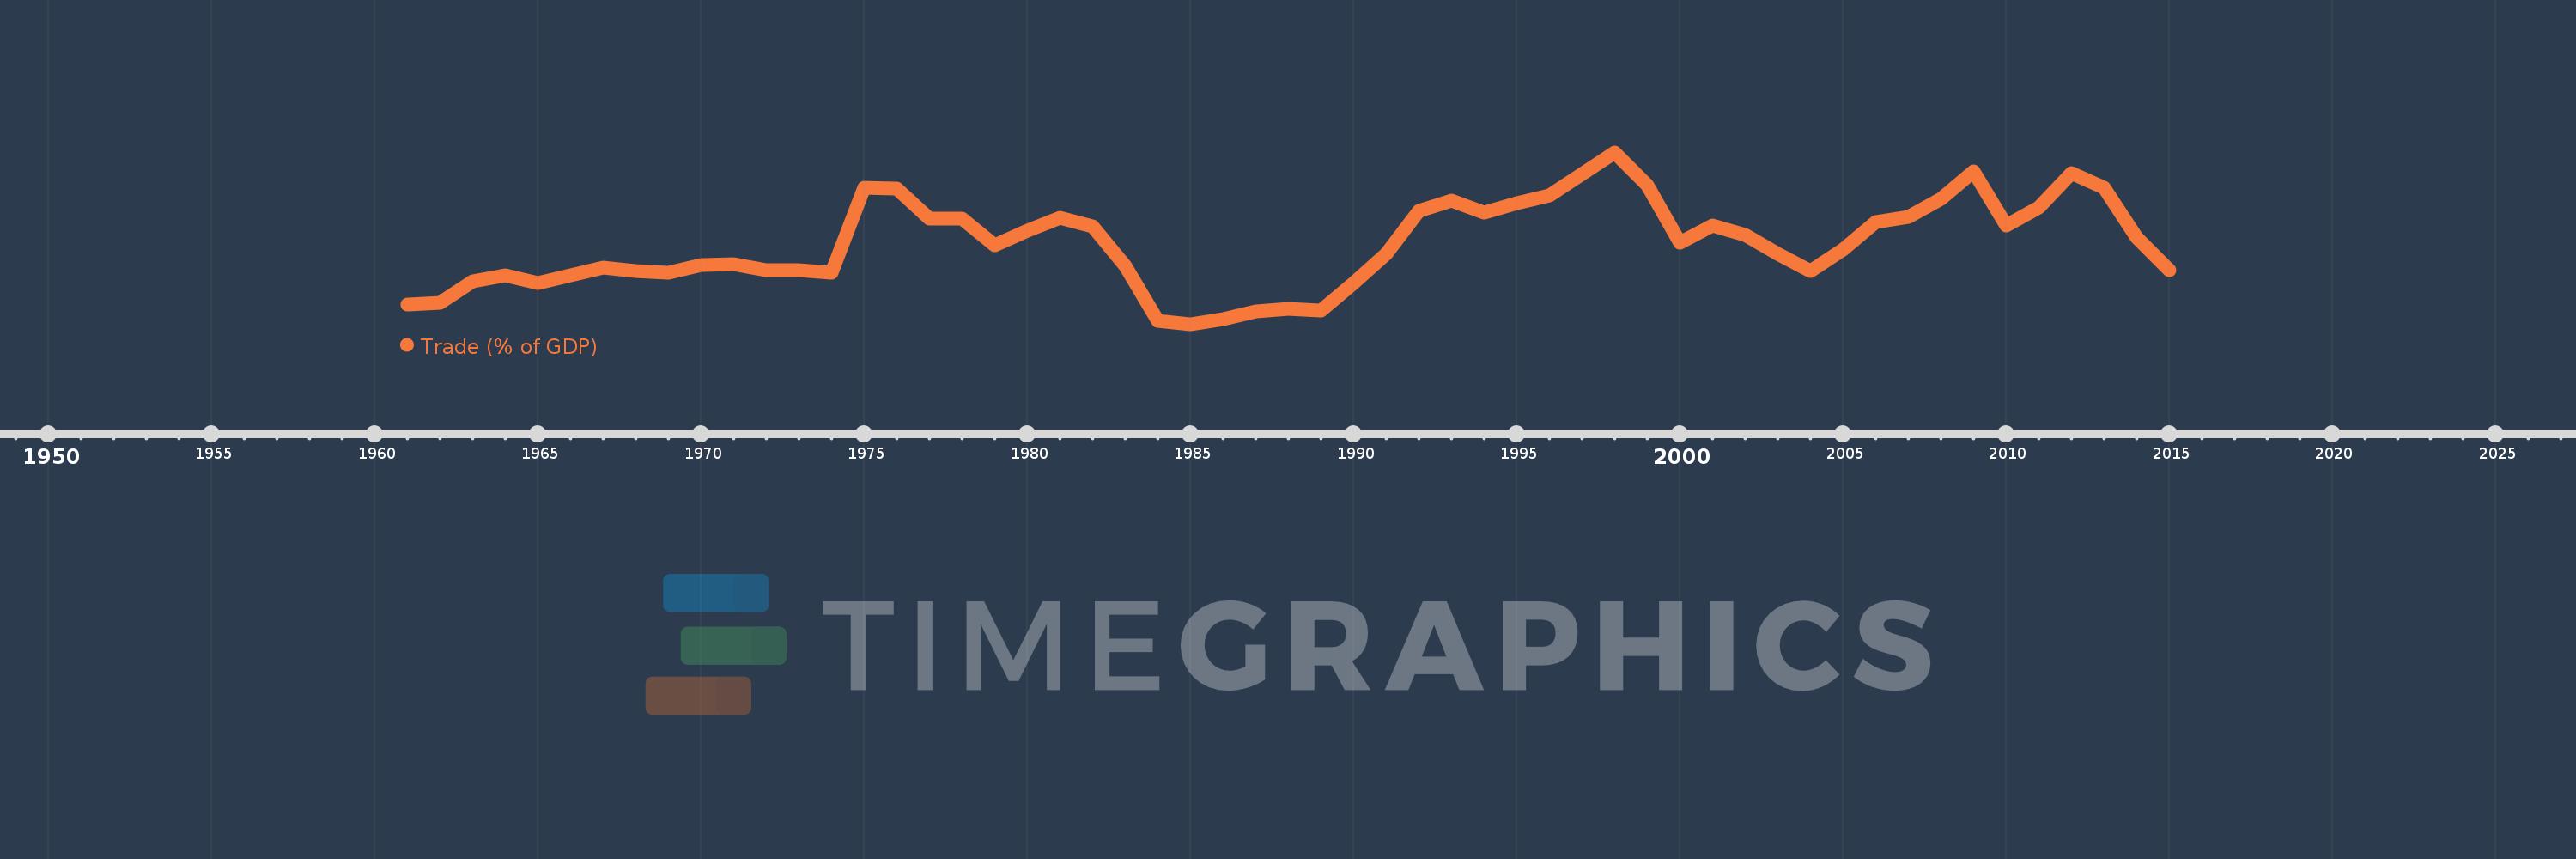
Trade (% of GDP)
2015,2014,2013,2012,2011,2010,2009,2008,2007,2006,2005,2004,2003,2002,2001,2000,1999,1998,1997,1996,1995,1994,1993,1992,1991,1990,1989,1988,1987,1986,1985,1984,1983,1982,1981,1980,1979,1978,1977,1976,1975,1974,1973,1972,1971,1970,1969,1968,1967,1966,1965,1964,1963,1962,1961
Estas estatísticas em outros países:
AfghanistanAlbaniaAlgeriaAngolaAntigua and BarbudaArab WorldArgentinaArmeniaArubaAustraliaAustriaAzerbaijanBahamas, TheBahrainBangladeshBarbadosBelarusBelgiumBelizeBeninBermudaBhutanBoliviaBosnia and HerzegovinaBotswanaBrazilBrunei DarussalamBulgariaBurkina FasoBurundiCabo VerdeCambodiaCameroonCanadaCaribbean small statesCentral African RepublicCentral Europe and the BalticsChadChileChinaColombiaComorosCongo, Dem. Rep.Congo, Rep.Costa RicaCote d'IvoireCroatiaCubaCyprusCzech RepublicDenmarkDjiboutiDominicaDominican RepublicEarly-demographic dividendEast Asia & PacificEast Asia & Pacific (excluding high income)East Asia & Pacific (IDA & IBRD countries)EcuadorEgypt, Arab Rep.El SalvadorEquatorial GuineaEritreaEstoniaEthiopiaEuro areaEurope & Central AsiaEurope & Central Asia (excluding high income)Europe & Central Asia (IDA & IBRD countries)European UnionFaroe IslandsFijiFinlandFragile and conflict affected situationsFranceFrench PolynesiaGabonGambia, TheGeorgiaGermanyGhanaGreeceGrenadaGuatemalaGuineaGuinea-BissauGuyanaHaitiHeavily indebted poor countries (HIPC)High incomeHondurasHong Kong SAR, ChinaHungaryIBRD onlyIcelandIDA & IBRD totalIDA blendIDA onlyIDA totalIndiaIndonesiaIran, Islamic Rep.IraqIrelandIsraelItalyJamaicaJapanJordanKazakhstanKenyaKiribatiKorea, Rep.KosovoKuwaitKyrgyz RepublicLao PDRLate-demographic dividendLatin America & Caribbean Latin America & Caribbean (excluding high income)Latin America & the Caribbean (IDA & IBRD countries)LatviaLeast developed countries: UN classificationLebanonLesothoLiberiaLibyaLithuaniaLow & middle incomeLow incomeLower middle incomeLuxembourgMacao SAR, ChinaMacedonia, FYRMadagascarMalawiMalaysiaMaldivesMaliMaltaMauritaniaMauritiusMexicoMicronesia, Fed. Sts.Middle East & North AfricaMiddle East & North Africa (excluding high income)Middle East & North Africa (IDA & IBRD countries)Middle incomeMoldovaMongoliaMontenegroMoroccoMozambiqueMyanmarNamibiaNepalNetherlandsNew CaledoniaNew ZealandNicaraguaNigerNigeriaNorth AmericaNorwayOECD membersOmanOther small statesPacific island small statesPakistanPalauPanamaPapua New GuineaParaguayPeruPhilippinesPolandPortugalPost-demographic dividendPre-demographic dividendPuerto RicoQatarRomaniaRussian FederationRwandaSamoaSaudi ArabiaSenegalSerbiaSeychellesSierra LeoneSingaporeSlovak RepublicSloveniaSmall statesSolomon IslandsSomaliaSouth AfricaSouth AsiaSouth Asia (IDA & IBRD)South SudanSpainSri LankaSt. Kitts and NevisSt. LuciaSt. Vincent and the GrenadinesSub-Saharan Africa Sub-Saharan Africa (excluding high income)Sub-Saharan Africa (IDA & IBRD countries)SudanSurinameSwazilandSwedenSwitzerlandSyrian Arab RepublicTajikistanTanzaniaThailandTimor-LesteTogoTongaTrinidad and TobagoTunisiaTurkeyTurkmenistanUgandaUkraineUnited Arab EmiratesUnited KingdomUnited StatesUpper middle incomeUruguayUzbekistanVanuatuVenezuela, RBVietnamWest Bank and GazaWorldYemen, Rep.ZambiaZimbabwe Linha do tempo:
Nesta escala de tempo está apresentado um gráfico de 1961 ano até 2015 ano Panama. Dados de 1960 ano ausente. O número de observações reais por data: 55.
Fonte (nome):
Indicadores de desenvolvimento mundial
Fonte (organização):
World Bank national accounts data, and OECD National Accounts data files.
Categorias:
Economy & Growth, Trade
Foi atualizado:
23 abr 2017 ano
Indicadores de alterações dos valores ao longo dos anos
Mínimo:
91.877
1 jan 1985 ano
Máximo:
165.344
1 jan 1998 ano
Na data de observação
Valor
Mudança absoluta
A alteração em relação ao valor anterior
1 jan 1961 ano
100.168
+100.168
0.0%
1 jan 1962 ano
100.855
+0.686
0.69%
1 jan 1963 ano
110.35
+9.496
9.42%
1 jan 1964 ano
112.751
+2.4
2.18%
1 jan 1965 ano
109.42
-3.331
-2.95%
1 jan 1966 ano
112.672
+3.252
2.97%
1 jan 1967 ano
116.111
+3.439
3.05%
1 jan 1968 ano
114.725
-1.386
-1.19%
1 jan 1969 ano
113.984
-0.741
-0.65%
1 jan 1970 ano
117.29
+3.306
2.9%
1 jan 1971 ano
117.373
+0.083
0.07%
1 jan 1972 ano
115.049
-2.324
-1.98%
1 jan 1973 ano
115.024
-0.025
-0.02%
1 jan 1974 ano
113.775
-1.249
-1.09%
1 jan 1975 ano
150.139
+36.364
31.96%
1 jan 1976 ano
149.827
-0.312
-0.21%
1 jan 1977 ano
137.069
-12.758
-8.52%
1 jan 1978 ano
137.02
-0.049
-0.04%
1 jan 1979 ano
125.818
-11.203
-8.18%
1 jan 1980 ano
131.863
+6.045
4.8%
1 jan 1981 ano
137.502
+5.639
4.28%
1 jan 1982 ano
133.723
-3.779
-2.75%
1 jan 1983 ano
116.785
-16.938
-12.67%
1 jan 1984 ano
93.135
-23.65
-20.25%
1 jan 1985 ano
91.877
-1.258
-1.35%
1 jan 1986 ano
94.06
+2.183
2.38%
1 jan 1987 ano
97.327
+3.268
3.47%
1 jan 1988 ano
98.591
+1.263
1.3%
1 jan 1989 ano
97.665
-0.925
-0.94%
1 jan 1990 ano
109.598
+11.932
12.22%
1 jan 1991 ano
121.794
+12.196
11.13%
1 jan 1992 ano
140.247
+18.453
15.15%
1 jan 1993 ano
144.879
+4.633
3.3%
1 jan 1994 ano
139.679
-5.2
-3.59%
1 jan 1995 ano
143.609
+3.93
2.81%
1 jan 1996 ano
146.905
+3.296
2.3%
1 jan 1997 ano
156.007
+9.101
6.2%
1 jan 1998 ano
165.344
+9.337
5.99%
1 jan 1999 ano
151.268
-14.075
-8.51%
1 jan 2000 ano
126.686
-24.582
-16.25%
1 jan 2001 ano
133.989
+7.303
5.76%
1 jan 2002 ano
130.098
-3.891
-2.9%
1 jan 2003 ano
121.852
-8.247
-6.34%
1 jan 2004 ano
114.693
-7.158
-5.87%
1 jan 2005 ano
123.653
+8.959
7.81%
1 jan 2006 ano
135.694
+12.042
9.74%
1 jan 2007 ano
137.896
+2.201
1.62%
1 jan 2008 ano
145.606
+7.71
5.59%
1 jan 2009 ano
157.069
+11.463
7.87%
1 jan 2010 ano
134.095
-22.974
-14.63%
1 jan 2011 ano
141.837
+7.742
5.77%
1 jan 2012 ano
156.608
+14.771
10.41%
1 jan 2013 ano
150.369
-6.239
-3.98%
1 jan 2014 ano
129.087
-21.282
-14.15%
1 jan 2015 ano
114.983
-14.104
-10.93%
Classificação de países por estatísticas atuais por anos


Comentários: