29
/pt/
pt
AIzaSyAYiBZKx7MnpbEhh9jyipgxe19OcubqV5w
April 1, 2024
223024
Peru
PER
true
2
1
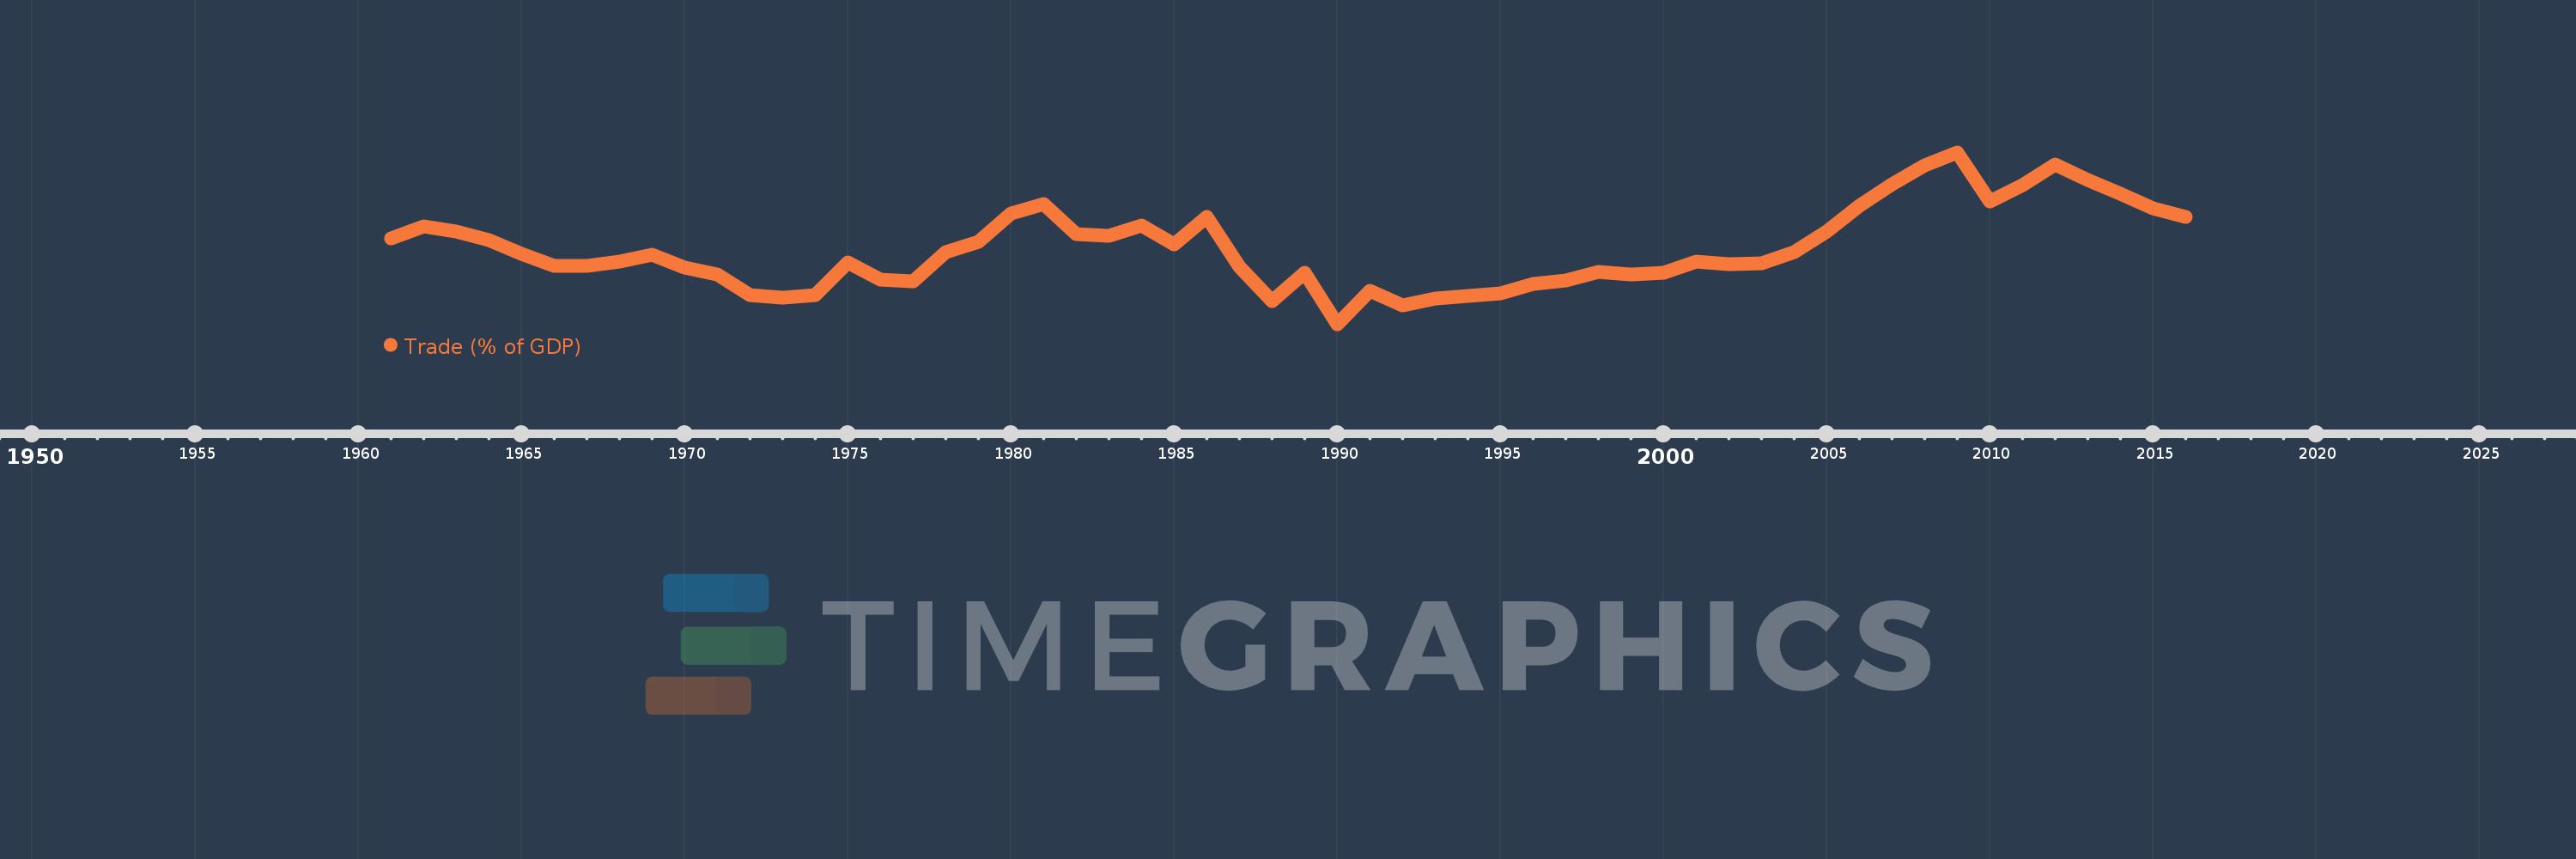
Trade (% of GDP)
2016,2015,2014,2013,2012,2011,2010,2009,2008,2007,2006,2005,2004,2003,2002,2001,2000,1999,1998,1997,1996,1995,1994,1993,1992,1991,1990,1989,1988,1987,1986,1985,1984,1983,1982,1981,1980,1979,1978,1977,1976,1975,1974,1973,1972,1971,1970,1969,1968,1967,1966,1965,1964,1963,1962,1961
Estas estatísticas em outros países:
AfghanistanAlbaniaAlgeriaAngolaAntigua and BarbudaArab WorldArgentinaArmeniaArubaAustraliaAustriaAzerbaijanBahamas, TheBahrainBangladeshBarbadosBelarusBelgiumBelizeBeninBermudaBhutanBoliviaBosnia and HerzegovinaBotswanaBrazilBrunei DarussalamBulgariaBurkina FasoBurundiCabo VerdeCambodiaCameroonCanadaCaribbean small statesCentral African RepublicCentral Europe and the BalticsChadChileChinaColombiaComorosCongo, Dem. Rep.Congo, Rep.Costa RicaCote d'IvoireCroatiaCubaCyprusCzech RepublicDenmarkDjiboutiDominicaDominican RepublicEarly-demographic dividendEast Asia & PacificEast Asia & Pacific (excluding high income)East Asia & Pacific (IDA & IBRD countries)EcuadorEgypt, Arab Rep.El SalvadorEquatorial GuineaEritreaEstoniaEthiopiaEuro areaEurope & Central AsiaEurope & Central Asia (excluding high income)Europe & Central Asia (IDA & IBRD countries)European UnionFaroe IslandsFijiFinlandFragile and conflict affected situationsFranceFrench PolynesiaGabonGambia, TheGeorgiaGermanyGhanaGreeceGrenadaGuatemalaGuineaGuinea-BissauGuyanaHaitiHeavily indebted poor countries (HIPC)High incomeHondurasHong Kong SAR, ChinaHungaryIBRD onlyIcelandIDA & IBRD totalIDA blendIDA onlyIDA totalIndiaIndonesiaIran, Islamic Rep.IraqIrelandIsraelItalyJamaicaJapanJordanKazakhstanKenyaKiribatiKorea, Rep.KosovoKuwaitKyrgyz RepublicLao PDRLate-demographic dividendLatin America & Caribbean Latin America & Caribbean (excluding high income)Latin America & the Caribbean (IDA & IBRD countries)LatviaLeast developed countries: UN classificationLebanonLesothoLiberiaLibyaLithuaniaLow & middle incomeLow incomeLower middle incomeLuxembourgMacao SAR, ChinaMacedonia, FYRMadagascarMalawiMalaysiaMaldivesMaliMaltaMauritaniaMauritiusMexicoMicronesia, Fed. Sts.Middle East & North AfricaMiddle East & North Africa (excluding high income)Middle East & North Africa (IDA & IBRD countries)Middle incomeMoldovaMongoliaMontenegroMoroccoMozambiqueMyanmarNamibiaNepalNetherlandsNew CaledoniaNew ZealandNicaraguaNigerNigeriaNorth AmericaNorwayOECD membersOmanOther small statesPacific island small statesPakistanPalauPanamaPapua New GuineaParaguayPeruPhilippinesPolandPortugalPost-demographic dividendPre-demographic dividendPuerto RicoQatarRomaniaRussian FederationRwandaSamoaSaudi ArabiaSenegalSerbiaSeychellesSierra LeoneSingaporeSlovak RepublicSloveniaSmall statesSolomon IslandsSomaliaSouth AfricaSouth AsiaSouth Asia (IDA & IBRD)South SudanSpainSri LankaSt. Kitts and NevisSt. LuciaSt. Vincent and the GrenadinesSub-Saharan Africa Sub-Saharan Africa (excluding high income)Sub-Saharan Africa (IDA & IBRD countries)SudanSurinameSwazilandSwedenSwitzerlandSyrian Arab RepublicTajikistanTanzaniaThailandTimor-LesteTogoTongaTrinidad and TobagoTunisiaTurkeyTurkmenistanUgandaUkraineUnited Arab EmiratesUnited KingdomUnited StatesUpper middle incomeUruguayUzbekistanVanuatuVenezuela, RBVietnamWest Bank and GazaWorldYemen, Rep.ZambiaZimbabwe Linha do tempo:
Nesta escala de tempo está apresentado um gráfico de 1961 ano até 2016 ano Peru. Dados de 1960 ano ausente. O número de observações reais por data: 56.
Fonte (nome):
Indicadores de desenvolvimento mundial
Fonte (organização):
World Bank national accounts data, and OECD National Accounts data files.
Categorias:
Economy & Growth, Trade
Foi atualizado:
23 abr 2017 ano
Indicadores de alterações dos valores ao longo dos anos
Mínimo:
22.537
1 jan 1990 ano
Máximo:
58.434
1 jan 2009 ano
Na data de observação
Valor
Mudança absoluta
A alteração em relação ao valor anterior
1 jan 1961 ano
40.481
+40.481
0.0%
1 jan 1962 ano
43.008
+2.527
6.24%
1 jan 1963 ano
41.926
-1.082
-2.52%
1 jan 1964 ano
40.026
-1.9
-4.53%
1 jan 1965 ano
37.312
-2.714
-6.78%
1 jan 1966 ano
34.664
-2.649
-7.1%
1 jan 1967 ano
34.728
+0.064
0.18%
1 jan 1968 ano
35.598
+0.87
2.51%
1 jan 1969 ano
36.984
+1.386
3.89%
1 jan 1970 ano
34.287
-2.697
-7.29%
1 jan 1971 ano
32.994
-1.293
-3.77%
1 jan 1972 ano
28.615
-4.379
-13.27%
1 jan 1973 ano
28.147
-0.468
-1.64%
1 jan 1974 ano
28.673
+0.526
1.87%
1 jan 1975 ano
35.463
+6.79
23.68%
1 jan 1976 ano
31.922
-3.541
-9.98%
1 jan 1977 ano
31.419
-0.504
-1.58%
1 jan 1978 ano
37.594
+6.175
19.65%
1 jan 1979 ano
39.711
+2.117
5.63%
1 jan 1980 ano
45.587
+5.876
14.8%
1 jan 1981 ano
47.643
+2.056
4.51%
1 jan 1982 ano
41.28
-6.363
-13.36%
1 jan 1983 ano
41.07
-0.21
-0.51%
1 jan 1984 ano
43.237
+2.166
5.27%
1 jan 1985 ano
39.19
-4.047
-9.36%
1 jan 1986 ano
44.879
+5.689
14.52%
1 jan 1987 ano
34.516
-10.362
-23.09%
1 jan 1988 ano
27.351
-7.165
-20.76%
1 jan 1989 ano
33.222
+5.871
21.47%
1 jan 1990 ano
22.537
-10.685
-32.16%
1 jan 1991 ano
29.47
+6.933
30.76%
1 jan 1992 ano
26.405
-3.065
-10.4%
1 jan 1993 ano
27.843
+1.438
5.45%
1 jan 1994 ano
28.5
+0.656
2.36%
1 jan 1995 ano
28.923
+0.423
1.48%
1 jan 1996 ano
30.927
+2.004
6.93%
1 jan 1997 ano
31.654
+0.727
2.35%
1 jan 1998 ano
33.47
+1.815
5.73%
1 jan 1999 ano
32.953
-0.517
-1.54%
1 jan 2000 ano
33.206
+0.253
0.77%
1 jan 2001 ano
35.538
+2.332
7.02%
1 jan 2002 ano
35.064
-0.474
-1.33%
1 jan 2003 ano
35.249
+0.185
0.53%
1 jan 2004 ano
37.625
+2.375
6.74%
1 jan 2005 ano
41.936
+4.311
11.46%
1 jan 2006 ano
47.357
+5.421
12.93%
1 jan 2007 ano
51.785
+4.428
9.35%
1 jan 2008 ano
55.688
+3.903
7.54%
1 jan 2009 ano
58.434
+2.746
4.93%
1 jan 2010 ano
48.112
-10.322
-17.66%
1 jan 2011 ano
51.673
+3.561
7.4%
1 jan 2012 ano
55.988
+4.315
8.35%
1 jan 2013 ano
52.62
-3.368
-6.02%
1 jan 2014 ano
49.777
-2.843
-5.4%
1 jan 2015 ano
46.792
-2.984
-6.0%
1 jan 2016 ano
45.008
-1.784
-3.81%
Classificação de países por estatísticas atuais por anos


Comentários: