29
/pt/
pt
AIzaSyAYiBZKx7MnpbEhh9jyipgxe19OcubqV5w
April 1, 2024
159986
Ireland
IRL
true
2
1
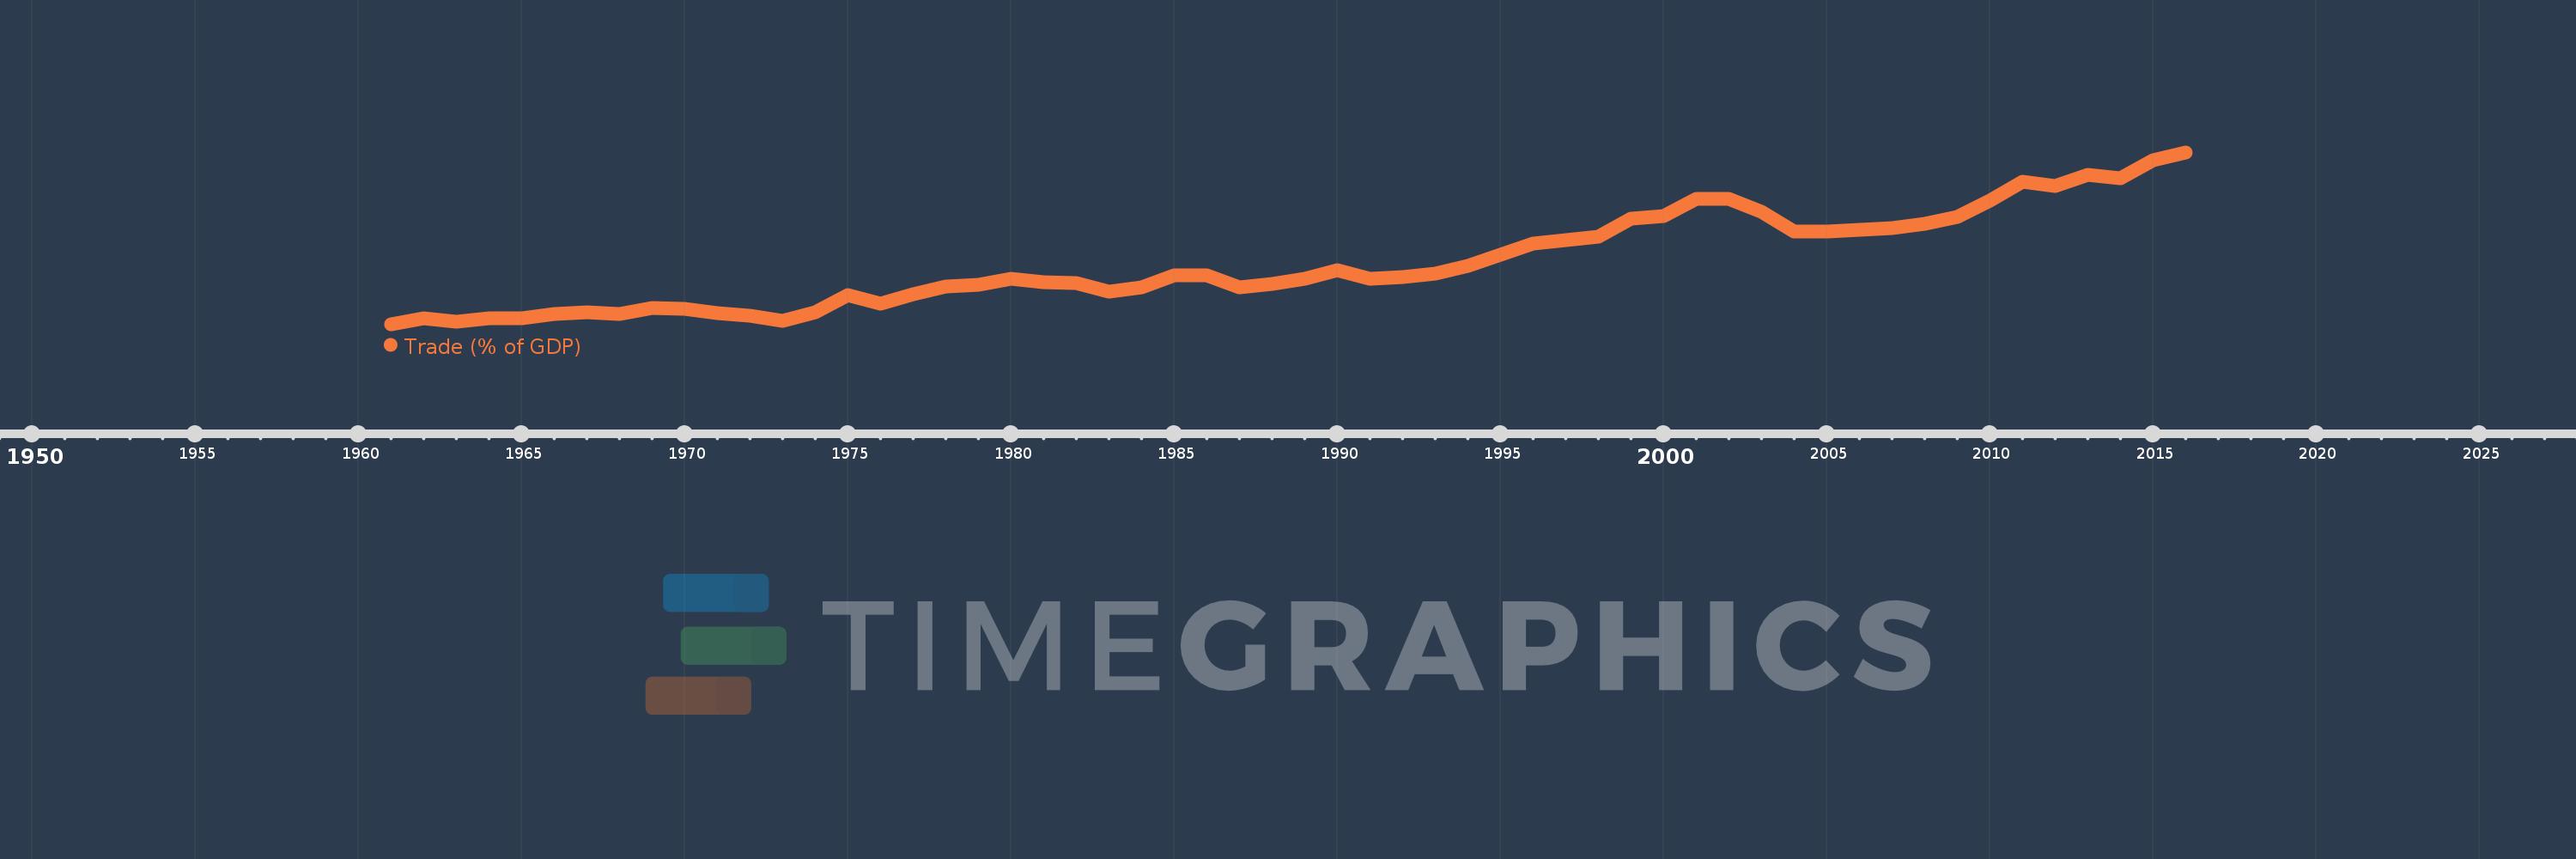
Trade (% of GDP)
2016,2015,2014,2013,2012,2011,2010,2009,2008,2007,2006,2005,2004,2003,2002,2001,2000,1999,1998,1997,1996,1995,1994,1993,1992,1991,1990,1989,1988,1987,1986,1985,1984,1983,1982,1981,1980,1979,1978,1977,1976,1975,1974,1973,1972,1971,1970,1969,1968,1967,1966,1965,1964,1963,1962,1961
Estas estatísticas em outros países:
AfghanistanAlbaniaAlgeriaAngolaAntigua and BarbudaArab WorldArgentinaArmeniaArubaAustraliaAustriaAzerbaijanBahamas, TheBahrainBangladeshBarbadosBelarusBelgiumBelizeBeninBermudaBhutanBoliviaBosnia and HerzegovinaBotswanaBrazilBrunei DarussalamBulgariaBurkina FasoBurundiCabo VerdeCambodiaCameroonCanadaCaribbean small statesCentral African RepublicCentral Europe and the BalticsChadChileChinaColombiaComorosCongo, Dem. Rep.Congo, Rep.Costa RicaCote d'IvoireCroatiaCubaCyprusCzech RepublicDenmarkDjiboutiDominicaDominican RepublicEarly-demographic dividendEast Asia & PacificEast Asia & Pacific (excluding high income)East Asia & Pacific (IDA & IBRD countries)EcuadorEgypt, Arab Rep.El SalvadorEquatorial GuineaEritreaEstoniaEthiopiaEuro areaEurope & Central AsiaEurope & Central Asia (excluding high income)Europe & Central Asia (IDA & IBRD countries)European UnionFaroe IslandsFijiFinlandFragile and conflict affected situationsFranceFrench PolynesiaGabonGambia, TheGeorgiaGermanyGhanaGreeceGrenadaGuatemalaGuineaGuinea-BissauGuyanaHaitiHeavily indebted poor countries (HIPC)High incomeHondurasHong Kong SAR, ChinaHungaryIBRD onlyIcelandIDA & IBRD totalIDA blendIDA onlyIDA totalIndiaIndonesiaIran, Islamic Rep.IraqIrelandIsraelItalyJamaicaJapanJordanKazakhstanKenyaKiribatiKorea, Rep.KosovoKuwaitKyrgyz RepublicLao PDRLate-demographic dividendLatin America & Caribbean Latin America & Caribbean (excluding high income)Latin America & the Caribbean (IDA & IBRD countries)LatviaLeast developed countries: UN classificationLebanonLesothoLiberiaLibyaLithuaniaLow & middle incomeLow incomeLower middle incomeLuxembourgMacao SAR, ChinaMacedonia, FYRMadagascarMalawiMalaysiaMaldivesMaliMaltaMauritaniaMauritiusMexicoMicronesia, Fed. Sts.Middle East & North AfricaMiddle East & North Africa (excluding high income)Middle East & North Africa (IDA & IBRD countries)Middle incomeMoldovaMongoliaMontenegroMoroccoMozambiqueMyanmarNamibiaNepalNetherlandsNew CaledoniaNew ZealandNicaraguaNigerNigeriaNorth AmericaNorwayOECD membersOmanOther small statesPacific island small statesPakistanPalauPanamaPapua New GuineaParaguayPeruPhilippinesPolandPortugalPost-demographic dividendPre-demographic dividendPuerto RicoQatarRomaniaRussian FederationRwandaSamoaSaudi ArabiaSenegalSerbiaSeychellesSierra LeoneSingaporeSlovak RepublicSloveniaSmall statesSolomon IslandsSomaliaSouth AfricaSouth AsiaSouth Asia (IDA & IBRD)South SudanSpainSri LankaSt. Kitts and NevisSt. LuciaSt. Vincent and the GrenadinesSub-Saharan Africa Sub-Saharan Africa (excluding high income)Sub-Saharan Africa (IDA & IBRD countries)SudanSurinameSwazilandSwedenSwitzerlandSyrian Arab RepublicTajikistanTanzaniaThailandTimor-LesteTogoTongaTrinidad and TobagoTunisiaTurkeyTurkmenistanUgandaUkraineUnited Arab EmiratesUnited KingdomUnited StatesUpper middle incomeUruguayUzbekistanVanuatuVenezuela, RBVietnamWest Bank and GazaWorldYemen, Rep.ZambiaZimbabwe Linha do tempo:
Nesta escala de tempo está apresentado um gráfico de 1961 ano até 2016 ano Ireland. Dados de 1960 ano ausente. O número de observações reais por data: 56.
Fonte (nome):
Indicadores de desenvolvimento mundial
Fonte (organização):
World Bank national accounts data, and OECD National Accounts data files.
Categorias:
Economy & Growth, Trade
Foi atualizado:
23 abr 2017 ano
Indicadores de alterações dos valores ao longo dos anos
Mínimo:
64.8
1 jan 1961 ano
Máximo:
216.243
1 jan 2016 ano
Na data de observação
Valor
Mudança absoluta
A alteração em relação ao valor anterior
1 jan 1961 ano
64.8
+64.8
0.0%
1 jan 1962 ano
69.755
+4.955
7.65%
1 jan 1963 ano
66.747
-3.008
-4.31%
1 jan 1964 ano
69.726
+2.979
4.46%
1 jan 1965 ano
69.777
+0.051
0.07%
1 jan 1966 ano
73.801
+4.024
5.77%
1 jan 1967 ano
75.416
+1.616
2.19%
1 jan 1968 ano
73.827
-1.589
-2.11%
1 jan 1969 ano
78.854
+5.027
6.81%
1 jan 1970 ano
78.468
-0.386
-0.49%
1 jan 1971 ano
74.352
-4.116
-5.25%
1 jan 1972 ano
72.132
-2.22
-2.99%
1 jan 1973 ano
67.562
-4.57
-6.34%
1 jan 1974 ano
75.161
+7.599
11.25%
1 jan 1975 ano
90.587
+15.426
20.52%
1 jan 1976 ano
82.965
-7.622
-8.41%
1 jan 1977 ano
91.148
+8.184
9.86%
1 jan 1978 ano
97.903
+6.755
7.41%
1 jan 1979 ano
99.614
+1.711
1.75%
1 jan 1980 ano
105.195
+5.581
5.6%
1 jan 1981 ano
102.202
-2.993
-2.85%
1 jan 1982 ano
100.875
-1.327
-1.3%
1 jan 1983 ano
93.877
-6.998
-6.94%
1 jan 1984 ano
97.64
+3.763
4.01%
1 jan 1985 ano
108.198
+10.559
10.81%
1 jan 1986 ano
107.655
-0.544
-0.5%
1 jan 1987 ano
97.029
-10.625
-9.87%
1 jan 1988 ano
100.645
+3.615
3.73%
1 jan 1989 ano
105.114
+4.47
4.44%
1 jan 1990 ano
112.354
+7.24
6.89%
1 jan 1991 ano
104.926
-7.429
-6.61%
1 jan 1992 ano
106.335
+1.409
1.34%
1 jan 1993 ano
109.437
+3.102
2.92%
1 jan 1994 ano
116.487
+7.05
6.44%
1 jan 1995 ano
126.364
+9.876
8.48%
1 jan 1996 ano
135.969
+9.605
7.6%
1 jan 1997 ano
138.732
+2.764
2.03%
1 jan 1998 ano
142.338
+3.606
2.6%
1 jan 1999 ano
158.008
+15.67
11.01%
1 jan 2000 ano
160.186
+2.178
1.38%
1 jan 2001 ano
175.137
+14.951
9.33%
1 jan 2002 ano
175.051
-0.087
-0.05%
1 jan 2003 ano
163.776
-11.275
-6.44%
1 jan 2004 ano
146.55
-17.225
-10.52%
1 jan 2005 ano
146.697
+0.147
0.1%
1 jan 2006 ano
148.254
+1.557
1.06%
1 jan 2007 ano
149.905
+1.65
1.11%
1 jan 2008 ano
153.223
+3.318
2.21%
1 jan 2009 ano
159.694
+6.471
4.22%
1 jan 2010 ano
173.402
+13.708
8.58%
1 jan 2011 ano
190.11
+16.708
9.64%
1 jan 2012 ano
186.309
-3.8
-2.0%
1 jan 2013 ano
196.399
+10.09
5.42%
1 jan 2014 ano
193.385
-3.014
-1.53%
1 jan 2015 ano
209.657
+16.272
8.41%
1 jan 2016 ano
216.243
+6.586
3.14%
Classificação de países por estatísticas atuais por anos


Comentários: