29
/pt/
pt
AIzaSyAYiBZKx7MnpbEhh9jyipgxe19OcubqV5w
April 1, 2024
104323
Chad
TCD
true
2
1
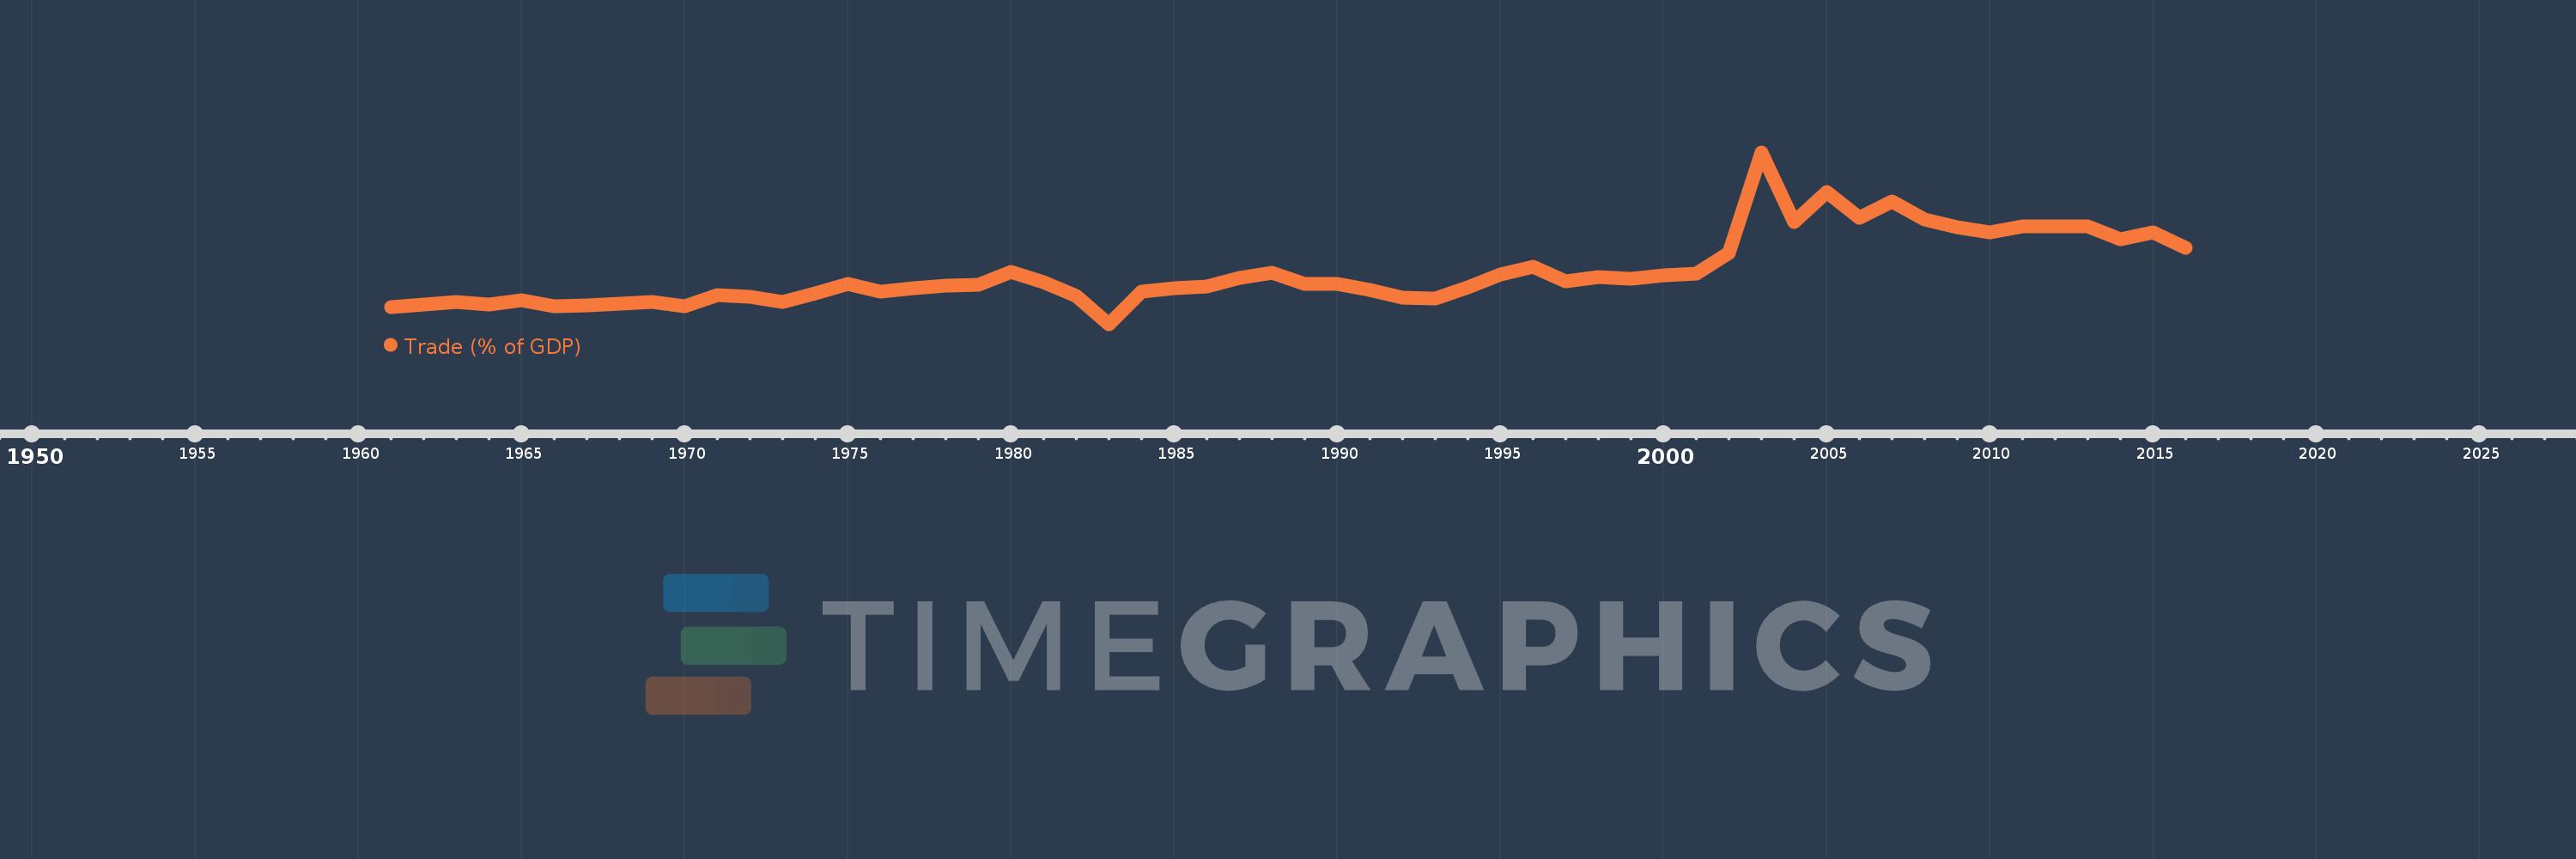
Trade (% of GDP)
2016,2015,2014,2013,2012,2011,2010,2009,2008,2007,2006,2005,2004,2003,2002,2001,2000,1999,1998,1997,1996,1995,1994,1993,1992,1991,1990,1989,1988,1987,1986,1985,1984,1983,1982,1981,1980,1979,1978,1977,1976,1975,1974,1973,1972,1971,1970,1969,1968,1967,1966,1965,1964,1963,1962,1961
Estas estatísticas em outros países:
AfghanistanAlbaniaAlgeriaAngolaAntigua and BarbudaArab WorldArgentinaArmeniaArubaAustraliaAustriaAzerbaijanBahamas, TheBahrainBangladeshBarbadosBelarusBelgiumBelizeBeninBermudaBhutanBoliviaBosnia and HerzegovinaBotswanaBrazilBrunei DarussalamBulgariaBurkina FasoBurundiCabo VerdeCambodiaCameroonCanadaCaribbean small statesCentral African RepublicCentral Europe and the BalticsChadChileChinaColombiaComorosCongo, Dem. Rep.Congo, Rep.Costa RicaCote d'IvoireCroatiaCubaCyprusCzech RepublicDenmarkDjiboutiDominicaDominican RepublicEarly-demographic dividendEast Asia & PacificEast Asia & Pacific (excluding high income)East Asia & Pacific (IDA & IBRD countries)EcuadorEgypt, Arab Rep.El SalvadorEquatorial GuineaEritreaEstoniaEthiopiaEuro areaEurope & Central AsiaEurope & Central Asia (excluding high income)Europe & Central Asia (IDA & IBRD countries)European UnionFaroe IslandsFijiFinlandFragile and conflict affected situationsFranceFrench PolynesiaGabonGambia, TheGeorgiaGermanyGhanaGreeceGrenadaGuatemalaGuineaGuinea-BissauGuyanaHaitiHeavily indebted poor countries (HIPC)High incomeHondurasHong Kong SAR, ChinaHungaryIBRD onlyIcelandIDA & IBRD totalIDA blendIDA onlyIDA totalIndiaIndonesiaIran, Islamic Rep.IraqIrelandIsraelItalyJamaicaJapanJordanKazakhstanKenyaKiribatiKorea, Rep.KosovoKuwaitKyrgyz RepublicLao PDRLate-demographic dividendLatin America & Caribbean Latin America & Caribbean (excluding high income)Latin America & the Caribbean (IDA & IBRD countries)LatviaLeast developed countries: UN classificationLebanonLesothoLiberiaLibyaLithuaniaLow & middle incomeLow incomeLower middle incomeLuxembourgMacao SAR, ChinaMacedonia, FYRMadagascarMalawiMalaysiaMaldivesMaliMaltaMauritaniaMauritiusMexicoMicronesia, Fed. Sts.Middle East & North AfricaMiddle East & North Africa (excluding high income)Middle East & North Africa (IDA & IBRD countries)Middle incomeMoldovaMongoliaMontenegroMoroccoMozambiqueMyanmarNamibiaNepalNetherlandsNew CaledoniaNew ZealandNicaraguaNigerNigeriaNorth AmericaNorwayOECD membersOmanOther small statesPacific island small statesPakistanPalauPanamaPapua New GuineaParaguayPeruPhilippinesPolandPortugalPost-demographic dividendPre-demographic dividendPuerto RicoQatarRomaniaRussian FederationRwandaSamoaSaudi ArabiaSenegalSerbiaSeychellesSierra LeoneSingaporeSlovak RepublicSloveniaSmall statesSolomon IslandsSomaliaSouth AfricaSouth AsiaSouth Asia (IDA & IBRD)South SudanSpainSri LankaSt. Kitts and NevisSt. LuciaSt. Vincent and the GrenadinesSub-Saharan Africa Sub-Saharan Africa (excluding high income)Sub-Saharan Africa (IDA & IBRD countries)SudanSurinameSwazilandSwedenSwitzerlandSyrian Arab RepublicTajikistanTanzaniaThailandTimor-LesteTogoTongaTrinidad and TobagoTunisiaTurkeyTurkmenistanUgandaUkraineUnited Arab EmiratesUnited KingdomUnited StatesUpper middle incomeUruguayUzbekistanVanuatuVenezuela, RBVietnamWest Bank and GazaWorldYemen, Rep.ZambiaZimbabwe Linha do tempo:
Nesta escala de tempo está apresentado um gráfico de 1961 ano até 2016 ano Chad. Dados de 1960 ano ausente. O número de observações reais por data: 56.
Fonte (nome):
Indicadores de desenvolvimento mundial
Fonte (organização):
World Bank national accounts data, and OECD National Accounts data files.
Categorias:
Economy & Growth, Trade
Foi atualizado:
23 abr 2017 ano
Indicadores de alterações dos valores ao longo dos anos
Mínimo:
20.057
1 jan 1983 ano
Máximo:
126.351
1 jan 2003 ano
Na data de observação
Valor
Mudança absoluta
A alteração em relação ao valor anterior
1 jan 1961 ano
30.427
+30.427
0.0%
1 jan 1962 ano
32.468
+2.041
6.71%
1 jan 1963 ano
33.659
+1.192
3.67%
1 jan 1964 ano
32.16
-1.499
-4.45%
1 jan 1965 ano
35.057
+2.897
9.01%
1 jan 1966 ano
31.313
-3.744
-10.68%
1 jan 1967 ano
31.876
+0.563
1.8%
1 jan 1968 ano
32.526
+0.65
2.04%
1 jan 1969 ano
33.626
+1.1
3.38%
1 jan 1970 ano
30.906
-2.72
-8.09%
1 jan 1971 ano
38.31
+7.404
23.96%
1 jan 1972 ano
36.97
-1.34
-3.5%
1 jan 1973 ano
33.949
-3.021
-8.17%
1 jan 1974 ano
39.229
+5.28
15.55%
1 jan 1975 ano
45.195
+5.966
15.21%
1 jan 1976 ano
40.253
-4.942
-10.93%
1 jan 1977 ano
42.468
+2.215
5.5%
1 jan 1978 ano
43.727
+1.259
2.96%
1 jan 1979 ano
44.39
+0.664
1.52%
1 jan 1980 ano
52.416
+8.026
18.08%
1 jan 1981 ano
45.811
-6.606
-12.6%
1 jan 1982 ano
37.762
-8.049
-17.57%
1 jan 1983 ano
20.057
-17.705
-46.89%
1 jan 1984 ano
39.96
+19.904
99.24%
1 jan 1985 ano
42.071
+2.11
5.28%
1 jan 1986 ano
43.234
+1.163
2.76%
1 jan 1987 ano
48.77
+5.536
12.81%
1 jan 1988 ano
51.882
+3.112
6.38%
1 jan 1989 ano
45.123
-6.758
-13.03%
1 jan 1990 ano
45.19
+0.067
0.15%
1 jan 1991 ano
41.387
-3.803
-8.42%
1 jan 1992 ano
36.35
-5.037
-12.17%
1 jan 1993 ano
35.905
-0.445
-1.22%
1 jan 1994 ano
42.647
+6.743
18.78%
1 jan 1995 ano
50.988
+8.341
19.56%
1 jan 1996 ano
55.697
+4.708
9.23%
1 jan 1997 ano
46.61
-9.087
-16.31%
1 jan 1998 ano
49.313
+2.703
5.8%
1 jan 1999 ano
48.059
-1.254
-2.54%
1 jan 2000 ano
50.508
+2.449
5.1%
1 jan 2001 ano
51.571
+1.063
2.11%
1 jan 2002 ano
64.322
+12.751
24.72%
1 jan 2003 ano
126.351
+62.029
96.44%
1 jan 2004 ano
83.379
-42.972
-34.01%
1 jan 2005 ano
101.769
+18.39
22.06%
1 jan 2006 ano
85.847
-15.922
-15.65%
1 jan 2007 ano
95.913
+10.066
11.73%
1 jan 2008 ano
84.731
-11.182
-11.66%
1 jan 2009 ano
80.29
-4.441
-5.24%
1 jan 2010 ano
77.109
-3.18
-3.96%
1 jan 2011 ano
80.391
+3.281
4.26%
1 jan 2012 ano
80.681
+0.29
0.36%
1 jan 2013 ano
80.576
-0.105
-0.13%
1 jan 2014 ano
72.649
-7.927
-9.84%
1 jan 2015 ano
76.627
+3.978
5.48%
1 jan 2016 ano
67.151
-9.475
-12.37%
Classificação de países por estatísticas atuais por anos


Comentários: