29
/pt/
pt
AIzaSyAYiBZKx7MnpbEhh9jyipgxe19OcubqV5w
April 1, 2024
40404
IDA total
IDA
false
2
1
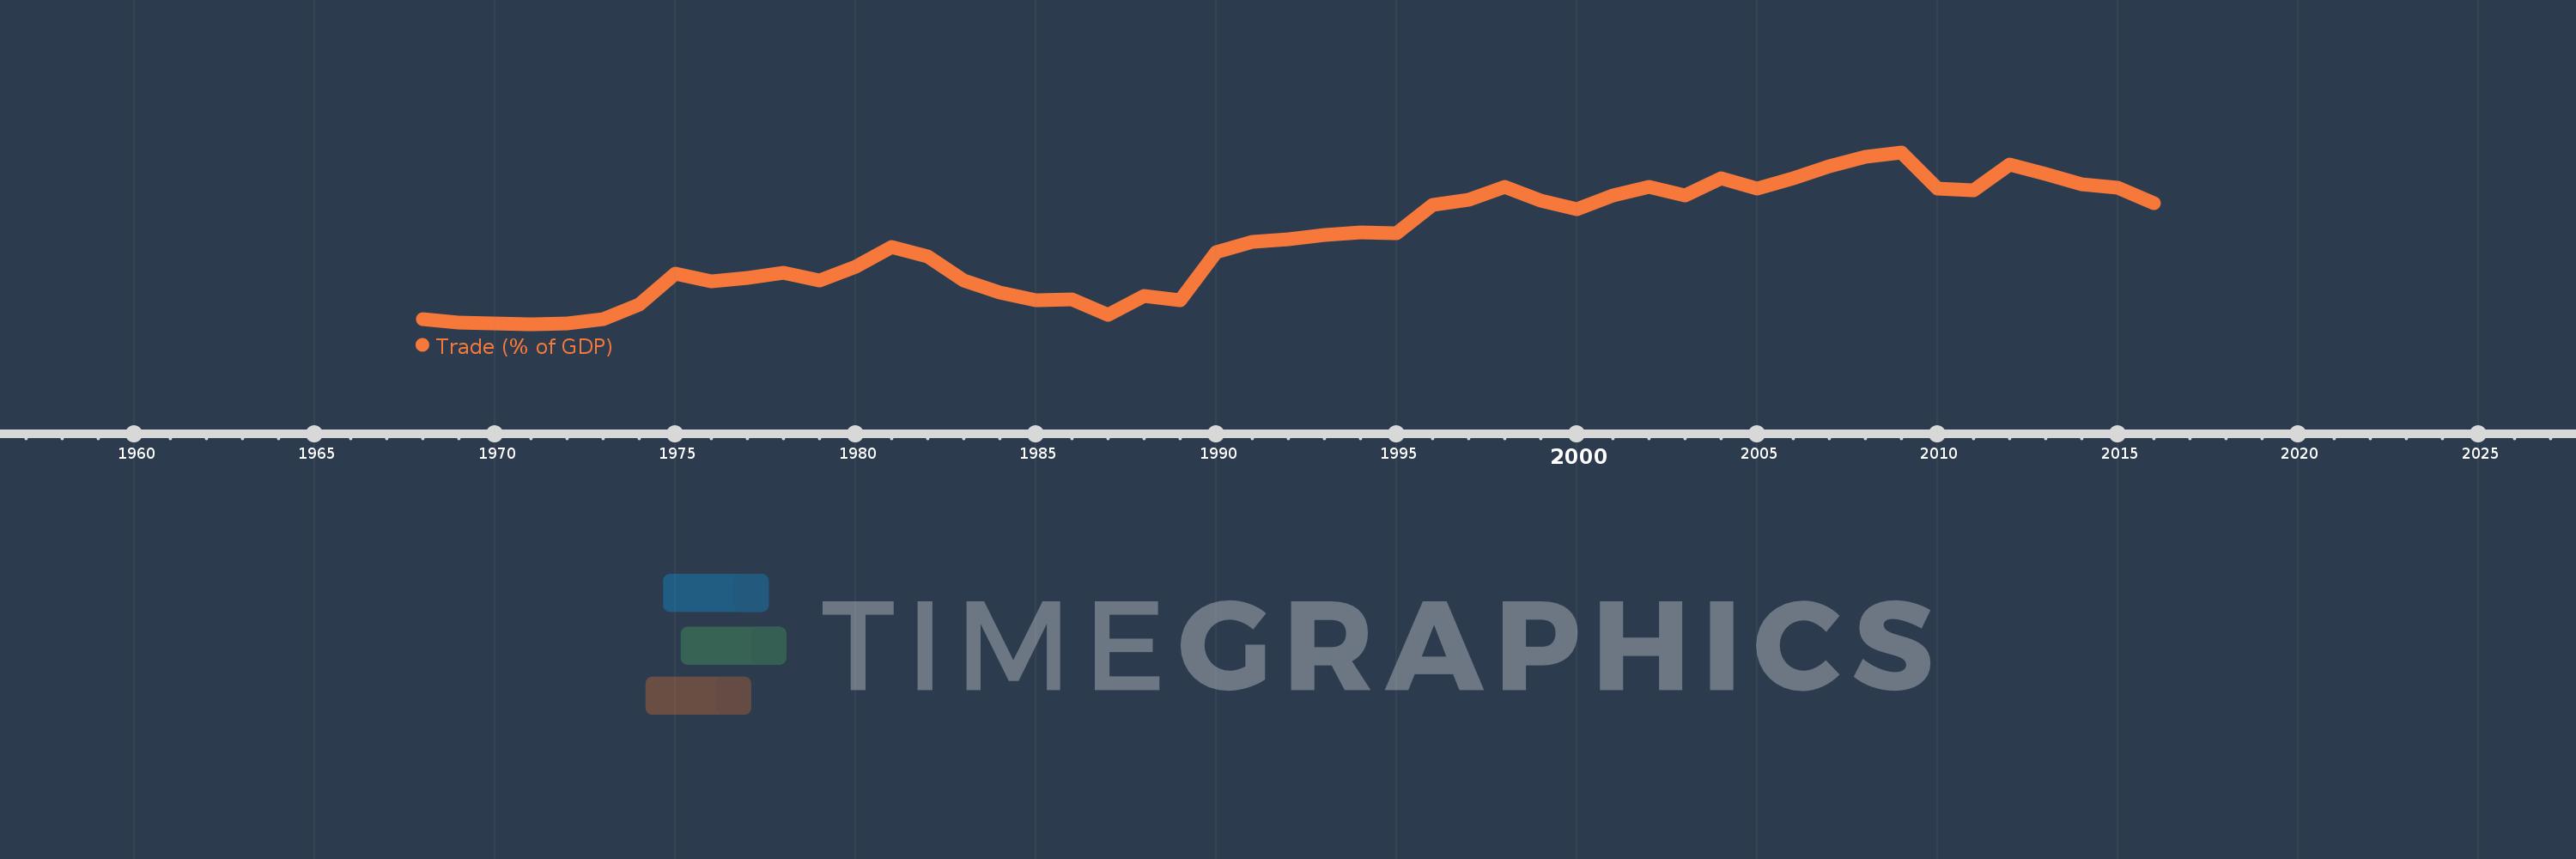
Trade (% of GDP)
2016,2015,2014,2013,2012,2011,2010,2009,2008,2007,2006,2005,2004,2003,2002,2001,2000,1999,1998,1997,1996,1995,1994,1993,1992,1991,1990,1989,1988,1987,1986,1985,1984,1983,1982,1981,1980,1979,1978,1977,1976,1975,1974,1973,1972,1971,1970,1969,1968
Estas estatísticas em outros países:
AfghanistanAlbaniaAlgeriaAngolaAntigua and BarbudaArab WorldArgentinaArmeniaArubaAustraliaAustriaAzerbaijanBahamas, TheBahrainBangladeshBarbadosBelarusBelgiumBelizeBeninBermudaBhutanBoliviaBosnia and HerzegovinaBotswanaBrazilBrunei DarussalamBulgariaBurkina FasoBurundiCabo VerdeCambodiaCameroonCanadaCaribbean small statesCentral African RepublicCentral Europe and the BalticsChadChileChinaColombiaComorosCongo, Dem. Rep.Congo, Rep.Costa RicaCote d'IvoireCroatiaCubaCyprusCzech RepublicDenmarkDjiboutiDominicaDominican RepublicEarly-demographic dividendEast Asia & PacificEast Asia & Pacific (excluding high income)East Asia & Pacific (IDA & IBRD countries)EcuadorEgypt, Arab Rep.El SalvadorEquatorial GuineaEritreaEstoniaEthiopiaEuro areaEurope & Central AsiaEurope & Central Asia (excluding high income)Europe & Central Asia (IDA & IBRD countries)European UnionFaroe IslandsFijiFinlandFragile and conflict affected situationsFranceFrench PolynesiaGabonGambia, TheGeorgiaGermanyGhanaGreeceGrenadaGuatemalaGuineaGuinea-BissauGuyanaHaitiHeavily indebted poor countries (HIPC)High incomeHondurasHong Kong SAR, ChinaHungaryIBRD onlyIcelandIDA & IBRD totalIDA blendIDA onlyIDA totalIndiaIndonesiaIran, Islamic Rep.IraqIrelandIsraelItalyJamaicaJapanJordanKazakhstanKenyaKiribatiKorea, Rep.KosovoKuwaitKyrgyz RepublicLao PDRLate-demographic dividendLatin America & Caribbean Latin America & Caribbean (excluding high income)Latin America & the Caribbean (IDA & IBRD countries)LatviaLeast developed countries: UN classificationLebanonLesothoLiberiaLibyaLithuaniaLow & middle incomeLow incomeLower middle incomeLuxembourgMacao SAR, ChinaMacedonia, FYRMadagascarMalawiMalaysiaMaldivesMaliMaltaMauritaniaMauritiusMexicoMicronesia, Fed. Sts.Middle East & North AfricaMiddle East & North Africa (excluding high income)Middle East & North Africa (IDA & IBRD countries)Middle incomeMoldovaMongoliaMontenegroMoroccoMozambiqueMyanmarNamibiaNepalNetherlandsNew CaledoniaNew ZealandNicaraguaNigerNigeriaNorth AmericaNorwayOECD membersOmanOther small statesPacific island small statesPakistanPalauPanamaPapua New GuineaParaguayPeruPhilippinesPolandPortugalPost-demographic dividendPre-demographic dividendPuerto RicoQatarRomaniaRussian FederationRwandaSamoaSaudi ArabiaSenegalSerbiaSeychellesSierra LeoneSingaporeSlovak RepublicSloveniaSmall statesSolomon IslandsSomaliaSouth AfricaSouth AsiaSouth Asia (IDA & IBRD)South SudanSpainSri LankaSt. Kitts and NevisSt. LuciaSt. Vincent and the GrenadinesSub-Saharan Africa Sub-Saharan Africa (excluding high income)Sub-Saharan Africa (IDA & IBRD countries)SudanSurinameSwazilandSwedenSwitzerlandSyrian Arab RepublicTajikistanTanzaniaThailandTimor-LesteTogoTongaTrinidad and TobagoTunisiaTurkeyTurkmenistanUgandaUkraineUnited Arab EmiratesUnited KingdomUnited StatesUpper middle incomeUruguayUzbekistanVanuatuVenezuela, RBVietnamWest Bank and GazaWorldYemen, Rep.ZambiaZimbabwe Linha do tempo:
Nesta escala de tempo está apresentado um gráfico de 1968 ano até 2016 ano IDA total. Dados de 1967 ano ausente. O número de observações reais por data: 49.
Fonte (nome):
Indicadores de desenvolvimento mundial
Fonte (organização):
World Bank national accounts data, and OECD National Accounts data files.
Categorias:
Economy & Growth, Trade
Foi atualizado:
23 abr 2017 ano
Indicadores de alterações dos valores ao longo dos anos
Mínimo:
33.032
1 jan 1971 ano
Máximo:
67.694
1 jan 2009 ano
Na data de observação
Valor
Mudança absoluta
A alteração em relação ao valor anterior
1 jan 1968 ano
34.055
+34.055
0.0%
1 jan 1969 ano
33.424
-0.631
-1.85%
1 jan 1970 ano
33.181
-0.244
-0.73%
1 jan 1971 ano
33.032
-0.149
-0.45%
1 jan 1972 ano
33.125
+0.093
0.28%
1 jan 1973 ano
34.083
+0.958
2.89%
1 jan 1974 ano
37.042
+2.958
8.68%
1 jan 1975 ano
43.308
+6.267
16.92%
1 jan 1976 ano
41.649
-1.659
-3.83%
1 jan 1977 ano
42.435
+0.786
1.89%
1 jan 1978 ano
43.347
+0.911
2.15%
1 jan 1979 ano
41.809
-1.538
-3.55%
1 jan 1980 ano
44.634
+2.825
6.76%
1 jan 1981 ano
48.546
+3.913
8.77%
1 jan 1982 ano
46.775
-1.771
-3.65%
1 jan 1983 ano
41.872
-4.903
-10.48%
1 jan 1984 ano
39.352
-2.52
-6.02%
1 jan 1985 ano
37.851
-1.501
-3.82%
1 jan 1986 ano
38.041
+0.19
0.5%
1 jan 1987 ano
35.001
-3.04
-7.99%
1 jan 1988 ano
38.805
+3.803
10.87%
1 jan 1989 ano
37.79
-1.014
-2.61%
1 jan 1990 ano
47.638
+9.847
26.06%
1 jan 1991 ano
49.579
+1.941
4.08%
1 jan 1992 ano
50.213
+0.634
1.28%
1 jan 1993 ano
50.959
+0.746
1.49%
1 jan 1994 ano
51.586
+0.627
1.23%
1 jan 1995 ano
51.458
-0.128
-0.25%
1 jan 1996 ano
57.098
+5.64
10.96%
1 jan 1997 ano
58.11
+1.012
1.77%
1 jan 1998 ano
60.829
+2.719
4.68%
1 jan 1999 ano
58.048
-2.781
-4.57%
1 jan 2000 ano
56.311
-1.736
-2.99%
1 jan 2001 ano
59.007
+2.695
4.79%
1 jan 2002 ano
60.825
+1.818
3.08%
1 jan 2003 ano
58.978
-1.846
-3.04%
1 jan 2004 ano
62.391
+3.413
5.79%
1 jan 2005 ano
60.404
-1.987
-3.19%
1 jan 2006 ano
62.395
+1.992
3.3%
1 jan 2007 ano
64.975
+2.579
4.13%
1 jan 2008 ano
66.765
+1.79
2.75%
1 jan 2009 ano
67.694
+0.93
1.39%
1 jan 2010 ano
60.403
-7.291
-10.77%
1 jan 2011 ano
60.048
-0.356
-0.59%
1 jan 2012 ano
65.236
+5.188
8.64%
1 jan 2013 ano
63.317
-1.919
-2.94%
1 jan 2014 ano
61.19
-2.127
-3.36%
1 jan 2015 ano
60.61
-0.58
-0.95%
1 jan 2016 ano
57.394
-3.216
-5.31%
Classificação de países por estatísticas atuais por anos


Comentários: