29
/pt/
pt
AIzaSyAYiBZKx7MnpbEhh9jyipgxe19OcubqV5w
April 1, 2024
77364
Bahrain
BHR
true
2
1
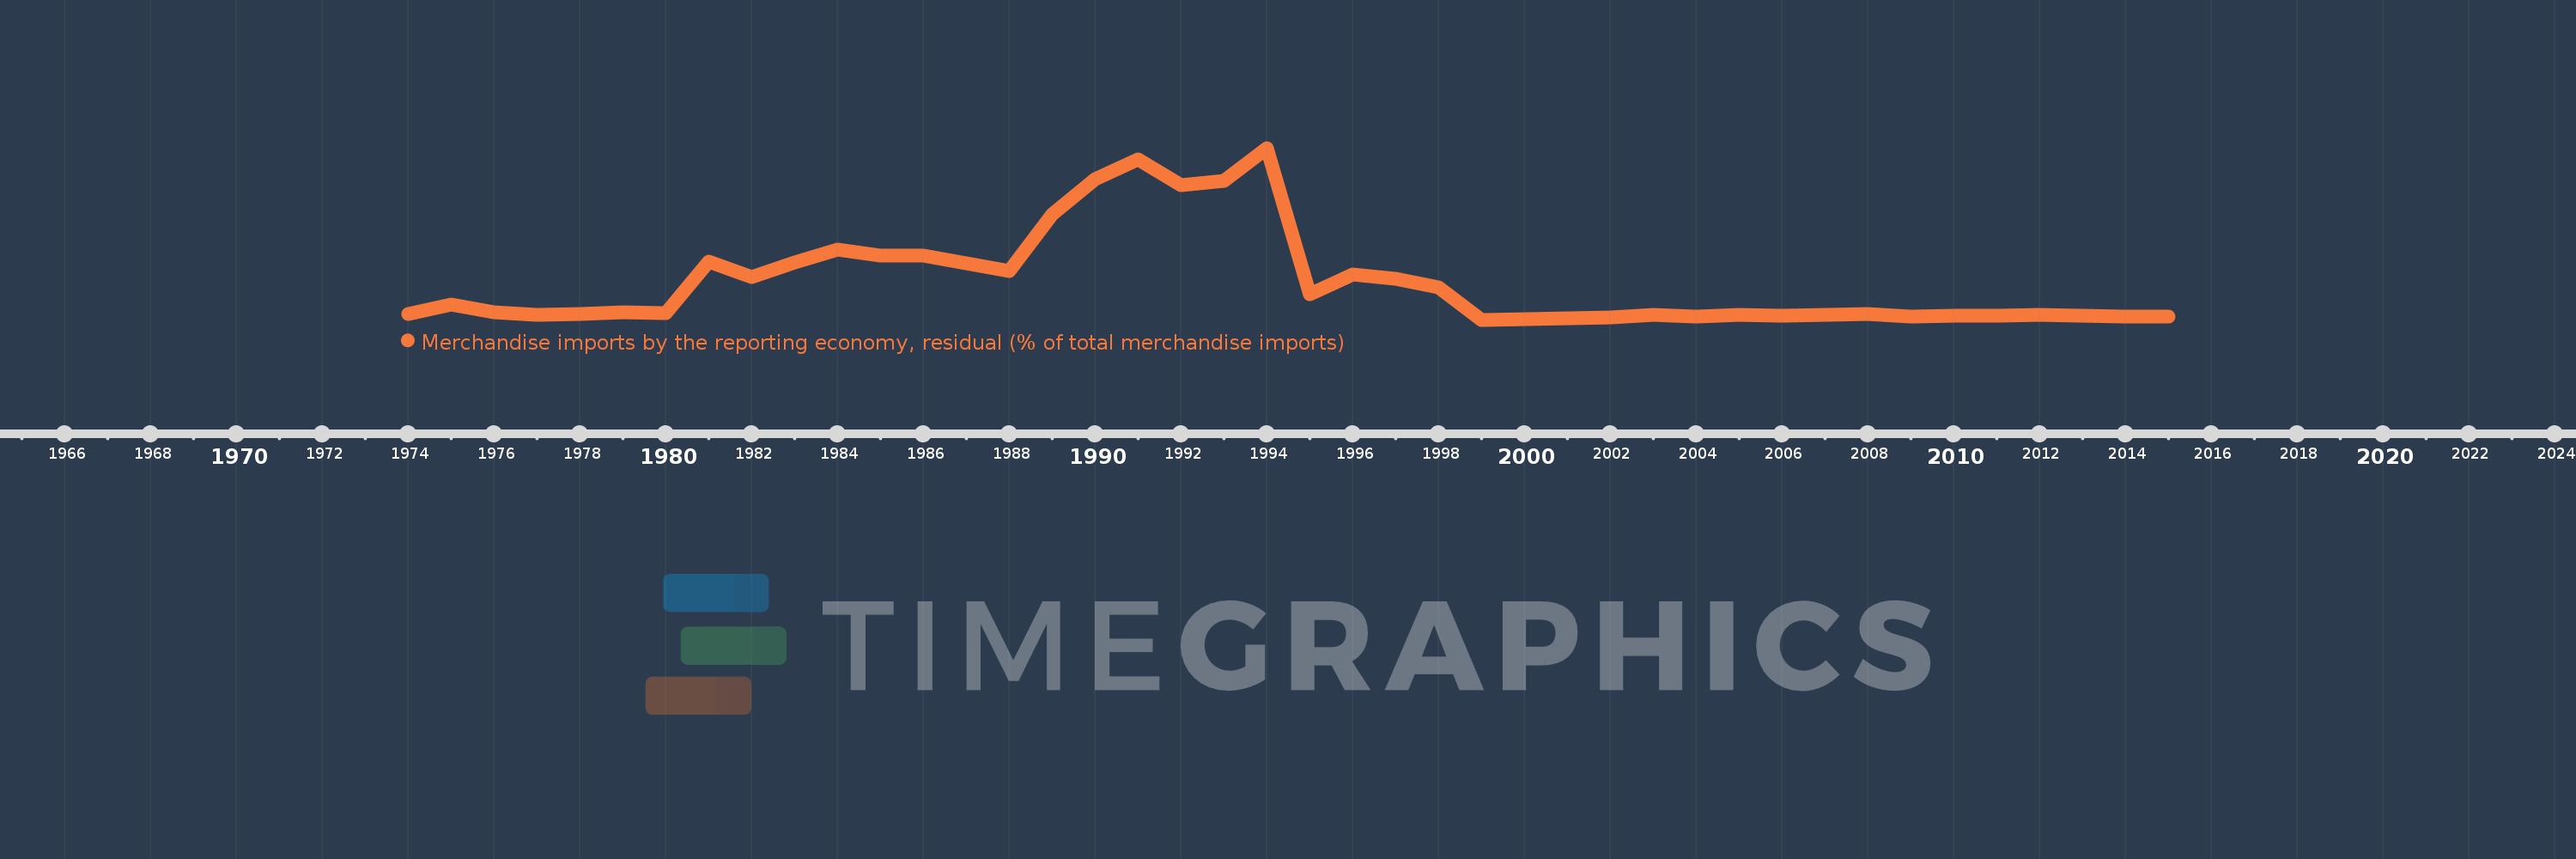
Merchandise imports by the reporting economy, residual (% of total merchandise imports)
2015,2014,2013,2012,2011,2010,2009,2008,2007,2006,2005,2004,2003,2002,2001,2000,1999,1998,1997,1996,1995,1994,1993,1992,1991,1990,1989,1988,1987,1986,1985,1984,1983,1982,1981,1980,1979,1978,1977,1976,1975,1974
Estas estatísticas em outros países:
AfghanistanAlbaniaAlgeriaAmerican SamoaAngolaAntigua and BarbudaArab WorldArgentinaArmeniaArubaAustraliaAustriaAzerbaijanBahamas, TheBahrainBangladeshBarbadosBelarusBelgiumBelizeBeninBermudaBoliviaBosnia and HerzegovinaBrazilBrunei DarussalamBulgariaBurkina FasoBurundiCabo VerdeCambodiaCameroonCanadaCaribbean small statesCentral African RepublicCentral Europe and the BalticsChadChileChinaColombiaComorosCongo, Dem. Rep.Congo, Rep.Costa RicaCote d'IvoireCroatiaCubaCyprusCzech RepublicDenmarkDjiboutiDominicaDominican RepublicEarly-demographic dividendEast Asia & PacificEast Asia & Pacific (excluding high income)East Asia & Pacific (IDA & IBRD countries)EcuadorEgypt, Arab Rep.El SalvadorEquatorial GuineaEstoniaEthiopiaEuro areaEurope & Central AsiaEurope & Central Asia (excluding high income)Europe & Central Asia (IDA & IBRD countries)European UnionFaroe IslandsFijiFinlandFragile and conflict affected situationsFranceFrench PolynesiaGabonGambia, TheGeorgiaGermanyGhanaGibraltarGreeceGreenlandGrenadaGuamGuatemalaGuineaGuinea-BissauGuyanaHaitiHeavily indebted poor countries (HIPC)High incomeHondurasHong Kong SAR, ChinaHungaryIBRD onlyIcelandIDA & IBRD totalIDA blendIDA onlyIDA totalIndiaIndonesiaIran, Islamic Rep.IraqIrelandIsraelItalyJamaicaJapanJordanKazakhstanKenyaKiribatiKorea, Dem. People’s Rep.Korea, Rep.KosovoKuwaitKyrgyz RepublicLao PDRLate-demographic dividendLatin America & Caribbean Latin America & Caribbean (excluding high income)Latin America & the Caribbean (IDA & IBRD countries)LatviaLeast developed countries: UN classificationLebanonLiberiaLibyaLithuaniaLow & middle incomeLow incomeLower middle incomeLuxembourgMacao SAR, ChinaMacedonia, FYRMadagascarMalawiMalaysiaMaldivesMaliMaltaMauritaniaMauritiusMexicoMiddle East & North AfricaMiddle East & North Africa (excluding high income)Middle East & North Africa (IDA & IBRD countries)Middle incomeMoldovaMongoliaMontenegroMoroccoMozambiqueMyanmarNauruNepalNetherlandsNew CaledoniaNew ZealandNicaraguaNigerNigeriaNorth AmericaNorwayOECD membersOmanOther small statesPacific island small statesPakistanPanamaPapua New GuineaParaguayPeruPhilippinesPolandPortugalPost-demographic dividendPre-demographic dividendQatarRomaniaRussian FederationRwandaSamoaSao Tome and PrincipeSaudi ArabiaSenegalSerbiaSeychellesSierra LeoneSingaporeSlovak RepublicSloveniaSmall statesSolomon IslandsSomaliaSouth AfricaSouth AsiaSouth Asia (IDA & IBRD)SpainSri LankaSt. Kitts and NevisSt. LuciaSt. Vincent and the GrenadinesSub-Saharan Africa Sub-Saharan Africa (excluding high income)Sub-Saharan Africa (IDA & IBRD countries)SudanSurinameSwedenSwitzerlandSyrian Arab RepublicTajikistanTanzaniaThailandTogoTongaTrinidad and TobagoTunisiaTurkeyTurkmenistanTuvaluUgandaUkraineUnited Arab EmiratesUnited KingdomUnited StatesUpper middle incomeUruguayUzbekistanVanuatuVenezuela, RBVietnamWorldYemen, Rep.ZambiaZimbabwe Linha do tempo:
Nesta escala de tempo está apresentado um gráfico de 1974 ano até 2015 ano Bahrain. Dados de 1973 ano ausente. O número de observações reais por data: 42.
Fonte (nome):
Indicadores de desenvolvimento mundial
Fonte (organização):
World Bank staff estimates based data from International Monetary Fund's Direction of Trade database.
Categorias:
Private Sector, Trade
Foi atualizado:
23 abr 2017 ano
Indicadores de alterações dos valores ao longo dos anos
Mínimo:
0.364
1 jan 1999 ano
Máximo:
9.026
1 jan 1994 ano
Na data de observação
Valor
Mudança absoluta
A alteração em relação ao valor anterior
1 jan 1974 ano
0.671
+0.671
0.0%
1 jan 1975 ano
1.151
+0.479
71.37%
1 jan 1976 ano
0.735
-0.415
-36.08%
1 jan 1977 ano
0.624
-0.112
-15.18%
1 jan 1978 ano
0.637
+0.013
2.1%
1 jan 1979 ano
0.735
+0.098
15.46%
1 jan 1980 ano
0.698
-0.037
-5.06%
1 jan 1981 ano
3.286
+2.587
370.58%
1 jan 1982 ano
2.52
-0.765
-23.29%
1 jan 1983 ano
3.245
+0.725
28.76%
1 jan 1984 ano
3.915
+0.67
20.64%
1 jan 1985 ano
3.582
-0.333
-8.5%
1 jan 1986 ano
3.582
0.0
0.0%
1 jan 1987 ano
3.191
-0.391
-10.93%
1 jan 1988 ano
2.822
-0.369
-11.57%
1 jan 1989 ano
5.692
+2.871
101.73%
1 jan 1990 ano
7.435
+1.742
30.61%
1 jan 1991 ano
8.429
+0.995
13.38%
1 jan 1992 ano
7.136
-1.293
-15.34%
1 jan 1993 ano
7.367
+0.231
3.23%
1 jan 1994 ano
9.026
+1.66
22.53%
1 jan 1995 ano
1.636
-7.39
-81.87%
1 jan 1996 ano
2.658
+1.022
62.48%
1 jan 1997 ano
2.432
-0.227
-8.52%
1 jan 1998 ano
1.998
-0.434
-17.86%
1 jan 1999 ano
0.364
-1.634
-81.8%
1 jan 2000 ano
0.391
+0.028
7.69%
1 jan 2001 ano
0.432
+0.041
10.42%
1 jan 2002 ano
0.475
+0.043
9.95%
1 jan 2003 ano
0.625
+0.15
31.58%
1 jan 2004 ano
0.53
-0.096
-15.31%
1 jan 2005 ano
0.601
+0.071
13.46%
1 jan 2006 ano
0.576
-0.025
-4.23%
1 jan 2007 ano
0.618
+0.042
7.3%
1 jan 2008 ano
0.633
+0.015
2.42%
1 jan 2009 ano
0.515
-0.117
-18.52%
1 jan 2010 ano
0.587
+0.072
13.88%
1 jan 2011 ano
0.589
+0.002
0.36%
1 jan 2012 ano
0.603
+0.014
2.44%
1 jan 2013 ano
0.574
-0.029
-4.86%
1 jan 2014 ano
0.542
-0.033
-5.67%
1 jan 2015 ano
0.532
-0.01
-1.81%
Classificação de países por estatísticas atuais por anos


Comentários: