29
/pt/
pt
AIzaSyAYiBZKx7MnpbEhh9jyipgxe19OcubqV5w
April 1, 2024
45302
Low & middle income
LMY
false
2
1
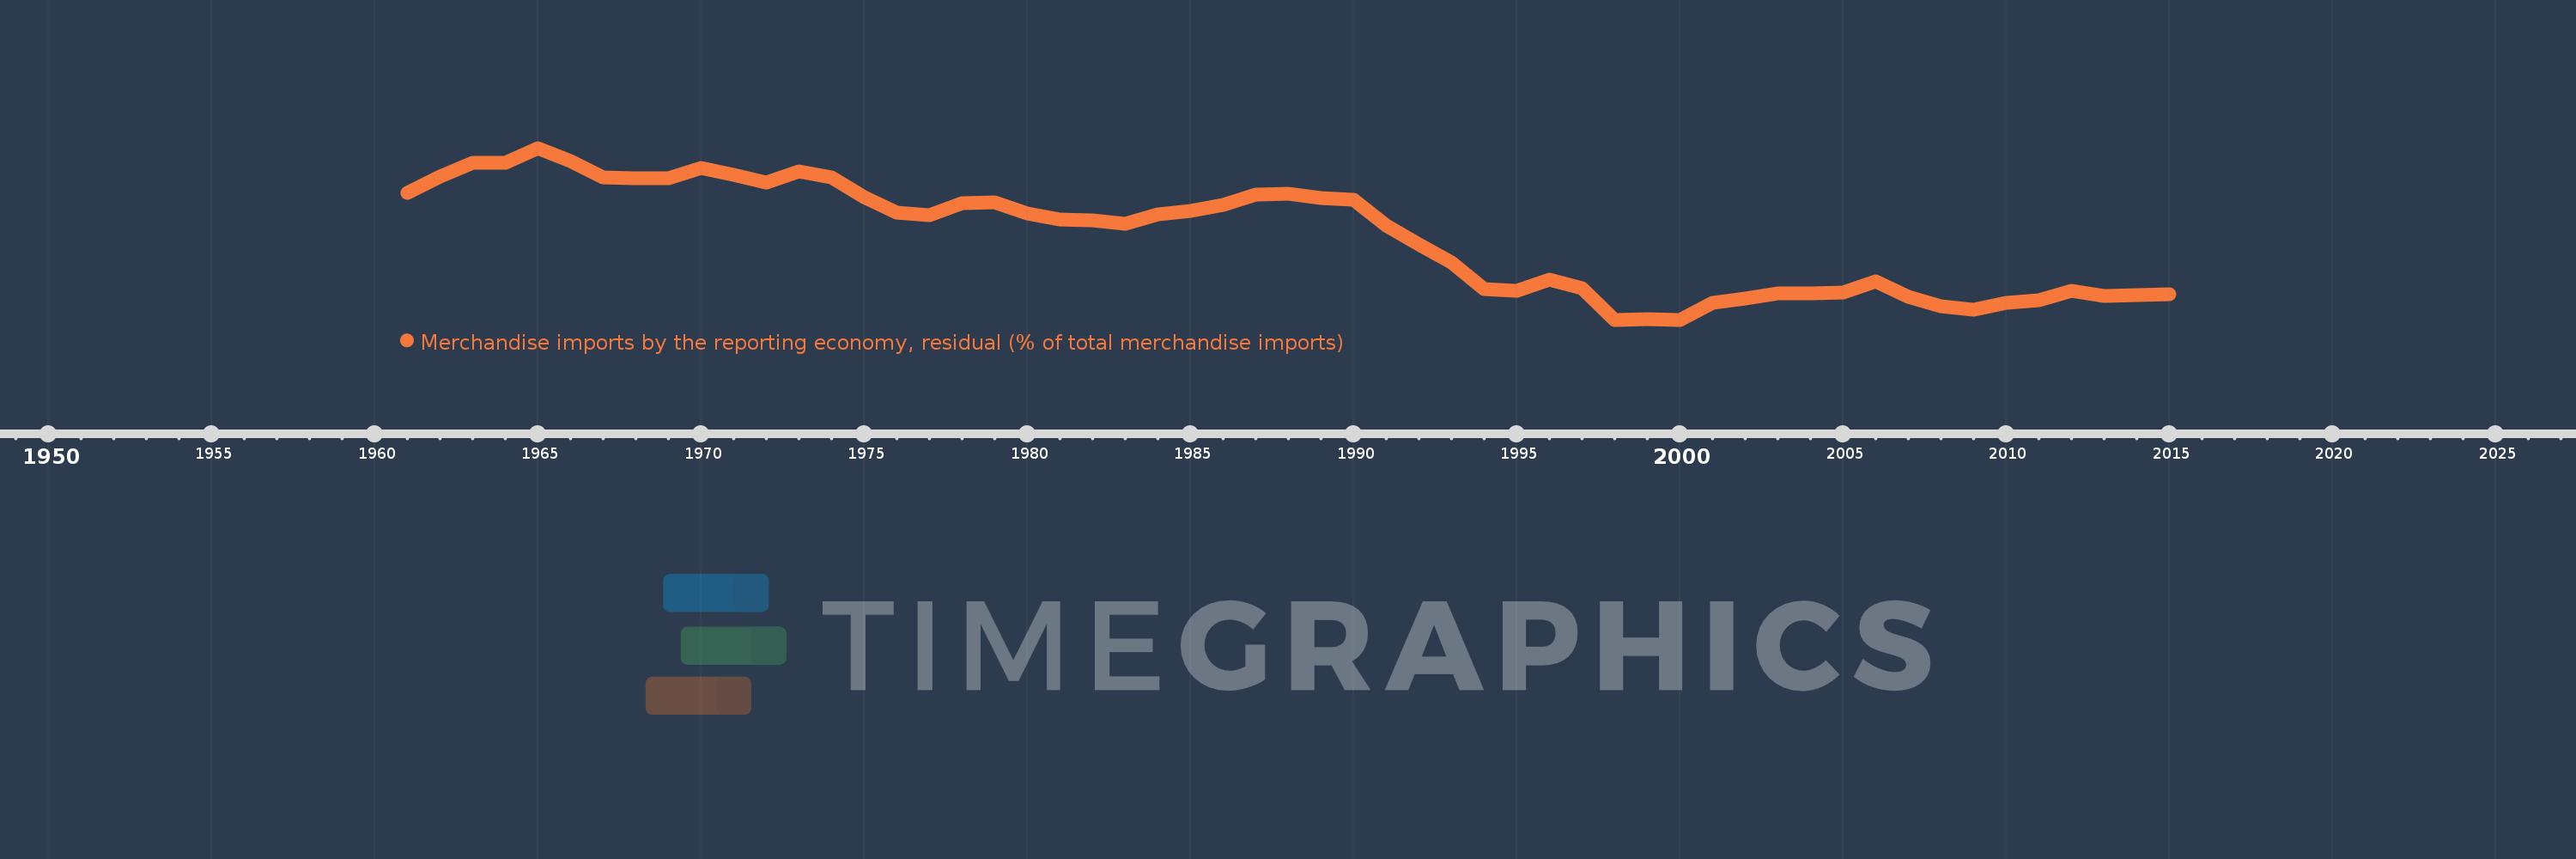
Merchandise imports by the reporting economy, residual (% of total merchandise imports)
2015,2014,2013,2012,2011,2010,2009,2008,2007,2006,2005,2004,2003,2002,2001,2000,1999,1998,1997,1996,1995,1994,1993,1992,1991,1990,1989,1988,1987,1986,1985,1984,1983,1982,1981,1980,1979,1978,1977,1976,1975,1974,1973,1972,1971,1970,1969,1968,1967,1966,1965,1964,1963,1962,1961
Estas estatísticas em outros países:
AfghanistanAlbaniaAlgeriaAmerican SamoaAngolaAntigua and BarbudaArab WorldArgentinaArmeniaArubaAustraliaAustriaAzerbaijanBahamas, TheBahrainBangladeshBarbadosBelarusBelgiumBelizeBeninBermudaBoliviaBosnia and HerzegovinaBrazilBrunei DarussalamBulgariaBurkina FasoBurundiCabo VerdeCambodiaCameroonCanadaCaribbean small statesCentral African RepublicCentral Europe and the BalticsChadChileChinaColombiaComorosCongo, Dem. Rep.Congo, Rep.Costa RicaCote d'IvoireCroatiaCubaCyprusCzech RepublicDenmarkDjiboutiDominicaDominican RepublicEarly-demographic dividendEast Asia & PacificEast Asia & Pacific (excluding high income)East Asia & Pacific (IDA & IBRD countries)EcuadorEgypt, Arab Rep.El SalvadorEquatorial GuineaEstoniaEthiopiaEuro areaEurope & Central AsiaEurope & Central Asia (excluding high income)Europe & Central Asia (IDA & IBRD countries)European UnionFaroe IslandsFijiFinlandFragile and conflict affected situationsFranceFrench PolynesiaGabonGambia, TheGeorgiaGermanyGhanaGibraltarGreeceGreenlandGrenadaGuamGuatemalaGuineaGuinea-BissauGuyanaHaitiHeavily indebted poor countries (HIPC)High incomeHondurasHong Kong SAR, ChinaHungaryIBRD onlyIcelandIDA & IBRD totalIDA blendIDA onlyIDA totalIndiaIndonesiaIran, Islamic Rep.IraqIrelandIsraelItalyJamaicaJapanJordanKazakhstanKenyaKiribatiKorea, Dem. People’s Rep.Korea, Rep.KosovoKuwaitKyrgyz RepublicLao PDRLate-demographic dividendLatin America & Caribbean Latin America & Caribbean (excluding high income)Latin America & the Caribbean (IDA & IBRD countries)LatviaLeast developed countries: UN classificationLebanonLiberiaLibyaLithuaniaLow & middle incomeLow incomeLower middle incomeLuxembourgMacao SAR, ChinaMacedonia, FYRMadagascarMalawiMalaysiaMaldivesMaliMaltaMauritaniaMauritiusMexicoMiddle East & North AfricaMiddle East & North Africa (excluding high income)Middle East & North Africa (IDA & IBRD countries)Middle incomeMoldovaMongoliaMontenegroMoroccoMozambiqueMyanmarNauruNepalNetherlandsNew CaledoniaNew ZealandNicaraguaNigerNigeriaNorth AmericaNorwayOECD membersOmanOther small statesPacific island small statesPakistanPanamaPapua New GuineaParaguayPeruPhilippinesPolandPortugalPost-demographic dividendPre-demographic dividendQatarRomaniaRussian FederationRwandaSamoaSao Tome and PrincipeSaudi ArabiaSenegalSerbiaSeychellesSierra LeoneSingaporeSlovak RepublicSloveniaSmall statesSolomon IslandsSomaliaSouth AfricaSouth AsiaSouth Asia (IDA & IBRD)SpainSri LankaSt. Kitts and NevisSt. LuciaSt. Vincent and the GrenadinesSub-Saharan Africa Sub-Saharan Africa (excluding high income)Sub-Saharan Africa (IDA & IBRD countries)SudanSurinameSwedenSwitzerlandSyrian Arab RepublicTajikistanTanzaniaThailandTogoTongaTrinidad and TobagoTunisiaTurkeyTurkmenistanTuvaluUgandaUkraineUnited Arab EmiratesUnited KingdomUnited StatesUpper middle incomeUruguayUzbekistanVanuatuVenezuela, RBVietnamWorldYemen, Rep.ZambiaZimbabwe Linha do tempo:
Nesta escala de tempo está apresentado um gráfico de 1961 ano até 2015 ano Low & middle income. Dados de 1960 ano ausente. O número de observações reais por data: 55.
Fonte (nome):
Indicadores de desenvolvimento mundial
Fonte (organização):
World Bank staff estimates based data from International Monetary Fund's Direction of Trade database.
Categorias:
Private Sector, Trade
Foi atualizado:
23 abr 2017 ano
Indicadores de alterações dos valores ao longo dos anos
Mínimo:
2.824
1 jan 2000 ano
Máximo:
13.367
1 jan 1965 ano
Na data de observação
Valor
Mudança absoluta
A alteração em relação ao valor anterior
1 jan 1961 ano
10.617
+10.617
0.0%
1 jan 1962 ano
11.635
+1.019
9.59%
1 jan 1963 ano
12.448
+0.813
6.99%
1 jan 1964 ano
12.433
-0.015
-0.12%
1 jan 1965 ano
13.367
+0.934
7.51%
1 jan 1966 ano
12.569
-0.798
-5.97%
1 jan 1967 ano
11.542
-1.027
-8.17%
1 jan 1968 ano
11.515
-0.027
-0.23%
1 jan 1969 ano
11.496
-0.019
-0.16%
1 jan 1970 ano
12.161
+0.664
5.78%
1 jan 1971 ano
11.713
-0.448
-3.68%
1 jan 1972 ano
11.25
-0.463
-3.96%
1 jan 1973 ano
11.93
+0.68
6.04%
1 jan 1974 ano
11.578
-0.352
-2.95%
1 jan 1975 ano
10.356
-1.222
-10.55%
1 jan 1976 ano
9.408
-0.948
-9.15%
1 jan 1977 ano
9.261
-0.147
-1.56%
1 jan 1978 ano
9.967
+0.706
7.62%
1 jan 1979 ano
10.032
+0.064
0.65%
1 jan 1980 ano
9.347
-0.684
-6.82%
1 jan 1981 ano
8.955
-0.392
-4.19%
1 jan 1982 ano
8.946
-0.009
-0.1%
1 jan 1983 ano
8.723
-0.223
-2.49%
1 jan 1984 ano
9.284
+0.561
6.43%
1 jan 1985 ano
9.515
+0.232
2.5%
1 jan 1986 ano
9.896
+0.381
4.0%
1 jan 1987 ano
10.521
+0.625
6.31%
1 jan 1988 ano
10.553
+0.032
0.3%
1 jan 1989 ano
10.28
-0.273
-2.59%
1 jan 1990 ano
10.18
-0.1
-0.98%
1 jan 1991 ano
8.618
-1.562
-15.34%
1 jan 1992 ano
7.421
-1.197
-13.89%
1 jan 1993 ano
6.357
-1.064
-14.33%
1 jan 1994 ano
4.7
-1.657
-26.06%
1 jan 1995 ano
4.595
-0.105
-2.24%
1 jan 1996 ano
5.311
+0.716
15.58%
1 jan 1997 ano
4.754
-0.557
-10.49%
1 jan 1998 ano
2.833
-1.921
-40.41%
1 jan 1999 ano
2.847
+0.015
0.52%
1 jan 2000 ano
2.824
-0.024
-0.83%
1 jan 2001 ano
3.838
+1.014
35.91%
1 jan 2002 ano
4.105
+0.266
6.94%
1 jan 2003 ano
4.418
+0.313
7.63%
1 jan 2004 ano
4.458
+0.04
0.91%
1 jan 2005 ano
4.486
+0.028
0.63%
1 jan 2006 ano
5.196
+0.711
15.84%
1 jan 2007 ano
4.243
-0.954
-18.35%
1 jan 2008 ano
3.657
-0.586
-13.8%
1 jan 2009 ano
3.427
-0.23
-6.3%
1 jan 2010 ano
3.846
+0.419
12.24%
1 jan 2011 ano
4.022
+0.176
4.58%
1 jan 2012 ano
4.602
+0.58
14.42%
1 jan 2013 ano
4.29
-0.312
-6.78%
1 jan 2014 ano
4.35
+0.06
1.39%
1 jan 2015 ano
4.373
+0.023
0.52%
Classificação de países por estatísticas atuais por anos


Comentários: