29
/pt/
pt
AIzaSyAYiBZKx7MnpbEhh9jyipgxe19OcubqV5w
April 1, 2024
210660
Nicaragua
NIC
true
2
1
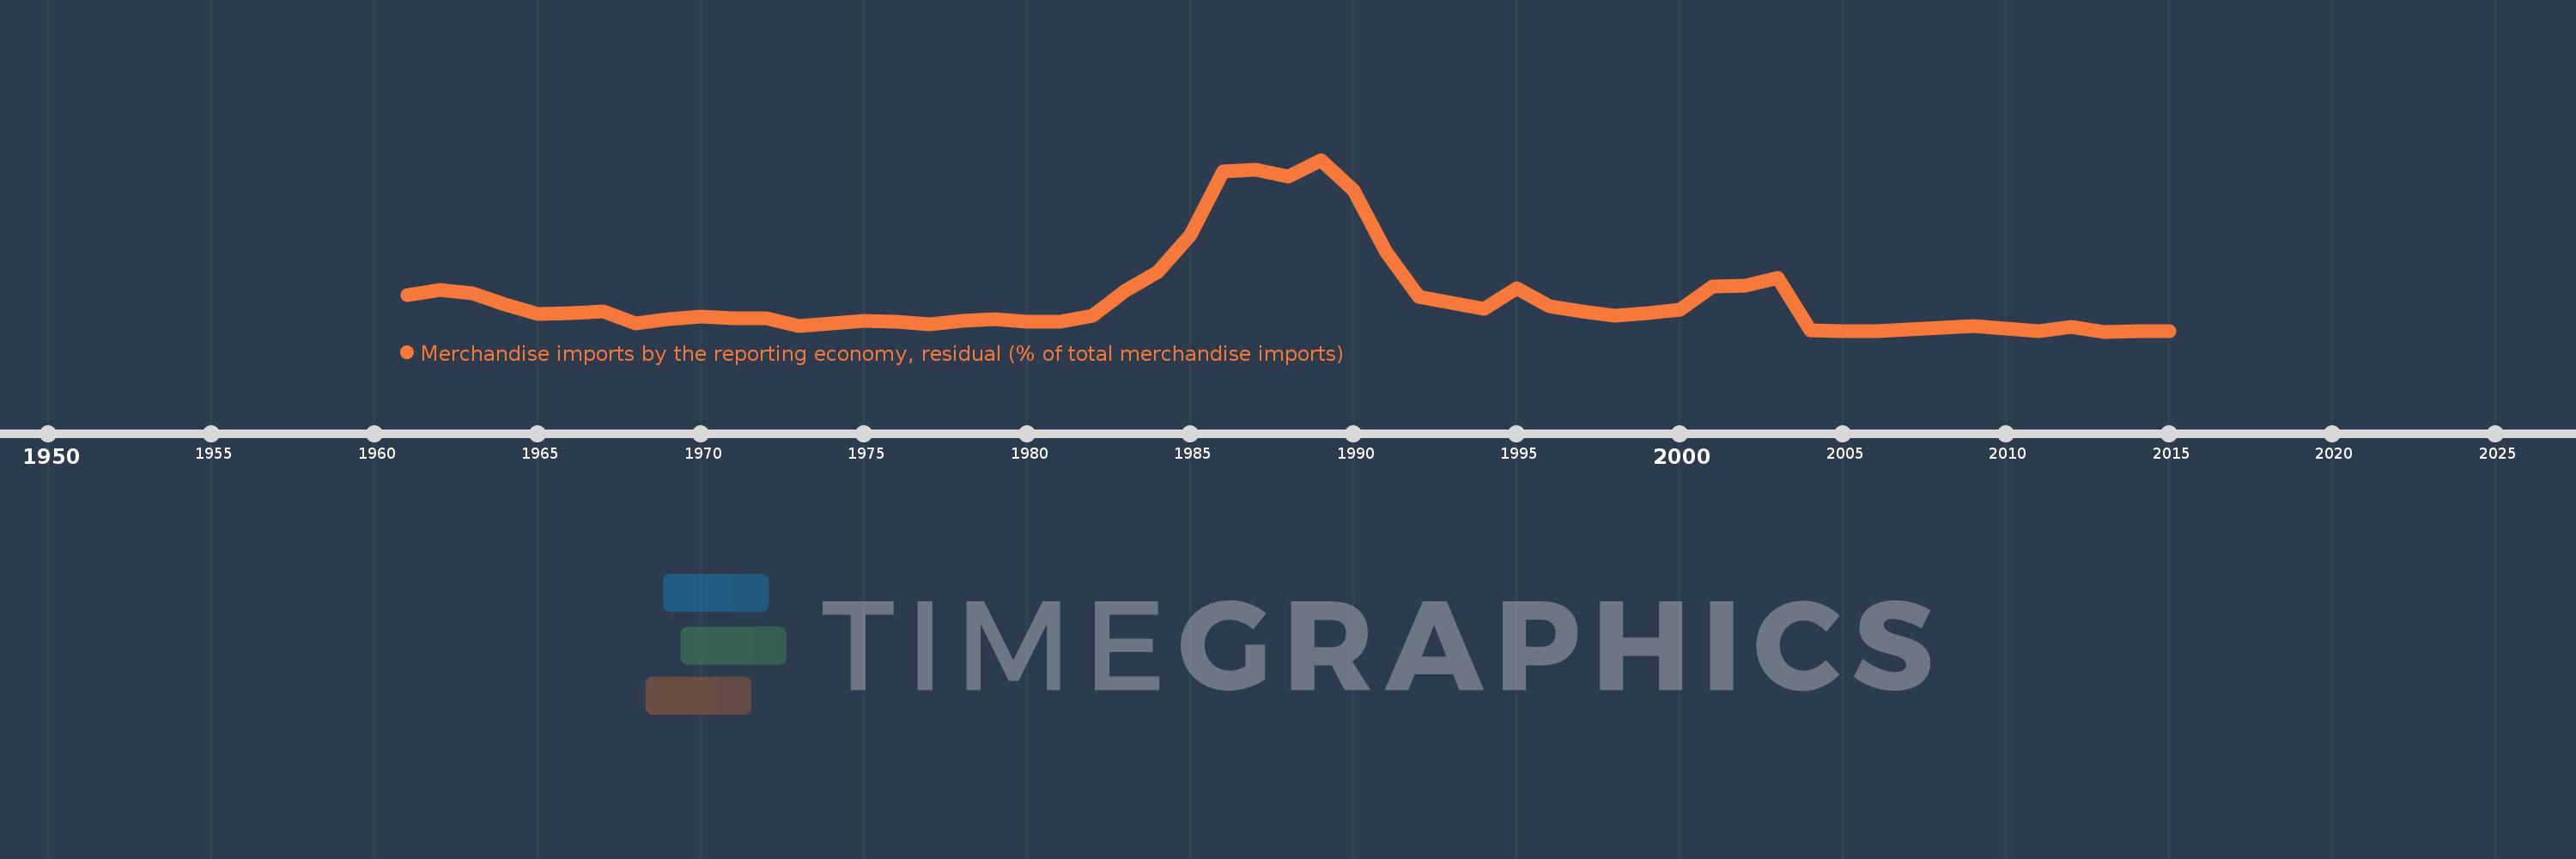
Merchandise imports by the reporting economy, residual (% of total merchandise imports)
2015,2014,2013,2012,2011,2010,2009,2008,2007,2006,2005,2004,2003,2002,2001,2000,1999,1998,1997,1996,1995,1994,1993,1992,1991,1990,1989,1988,1987,1986,1985,1984,1983,1982,1981,1980,1979,1978,1977,1976,1975,1974,1973,1972,1971,1970,1969,1968,1967,1966,1965,1964,1963,1962,1961
Estas estatísticas em outros países:
AfghanistanAlbaniaAlgeriaAmerican SamoaAngolaAntigua and BarbudaArab WorldArgentinaArmeniaArubaAustraliaAustriaAzerbaijanBahamas, TheBahrainBangladeshBarbadosBelarusBelgiumBelizeBeninBermudaBoliviaBosnia and HerzegovinaBrazilBrunei DarussalamBulgariaBurkina FasoBurundiCabo VerdeCambodiaCameroonCanadaCaribbean small statesCentral African RepublicCentral Europe and the BalticsChadChileChinaColombiaComorosCongo, Dem. Rep.Congo, Rep.Costa RicaCote d'IvoireCroatiaCubaCyprusCzech RepublicDenmarkDjiboutiDominicaDominican RepublicEarly-demographic dividendEast Asia & PacificEast Asia & Pacific (excluding high income)East Asia & Pacific (IDA & IBRD countries)EcuadorEgypt, Arab Rep.El SalvadorEquatorial GuineaEstoniaEthiopiaEuro areaEurope & Central AsiaEurope & Central Asia (excluding high income)Europe & Central Asia (IDA & IBRD countries)European UnionFaroe IslandsFijiFinlandFragile and conflict affected situationsFranceFrench PolynesiaGabonGambia, TheGeorgiaGermanyGhanaGibraltarGreeceGreenlandGrenadaGuamGuatemalaGuineaGuinea-BissauGuyanaHaitiHeavily indebted poor countries (HIPC)High incomeHondurasHong Kong SAR, ChinaHungaryIBRD onlyIcelandIDA & IBRD totalIDA blendIDA onlyIDA totalIndiaIndonesiaIran, Islamic Rep.IraqIrelandIsraelItalyJamaicaJapanJordanKazakhstanKenyaKiribatiKorea, Dem. People’s Rep.Korea, Rep.KosovoKuwaitKyrgyz RepublicLao PDRLate-demographic dividendLatin America & Caribbean Latin America & Caribbean (excluding high income)Latin America & the Caribbean (IDA & IBRD countries)LatviaLeast developed countries: UN classificationLebanonLiberiaLibyaLithuaniaLow & middle incomeLow incomeLower middle incomeLuxembourgMacao SAR, ChinaMacedonia, FYRMadagascarMalawiMalaysiaMaldivesMaliMaltaMauritaniaMauritiusMexicoMiddle East & North AfricaMiddle East & North Africa (excluding high income)Middle East & North Africa (IDA & IBRD countries)Middle incomeMoldovaMongoliaMontenegroMoroccoMozambiqueMyanmarNauruNepalNetherlandsNew CaledoniaNew ZealandNicaraguaNigerNigeriaNorth AmericaNorwayOECD membersOmanOther small statesPacific island small statesPakistanPanamaPapua New GuineaParaguayPeruPhilippinesPolandPortugalPost-demographic dividendPre-demographic dividendQatarRomaniaRussian FederationRwandaSamoaSao Tome and PrincipeSaudi ArabiaSenegalSerbiaSeychellesSierra LeoneSingaporeSlovak RepublicSloveniaSmall statesSolomon IslandsSomaliaSouth AfricaSouth AsiaSouth Asia (IDA & IBRD)SpainSri LankaSt. Kitts and NevisSt. LuciaSt. Vincent and the GrenadinesSub-Saharan Africa Sub-Saharan Africa (excluding high income)Sub-Saharan Africa (IDA & IBRD countries)SudanSurinameSwedenSwitzerlandSyrian Arab RepublicTajikistanTanzaniaThailandTogoTongaTrinidad and TobagoTunisiaTurkeyTurkmenistanTuvaluUgandaUkraineUnited Arab EmiratesUnited KingdomUnited StatesUpper middle incomeUruguayUzbekistanVanuatuVenezuela, RBVietnamWorldYemen, Rep.ZambiaZimbabwe Linha do tempo:
Nesta escala de tempo está apresentado um gráfico de 1961 ano até 2015 ano Nicaragua. Dados de 1960 ano ausente. O número de observações reais por data: 55.
Fonte (nome):
Indicadores de desenvolvimento mundial
Fonte (organização):
World Bank staff estimates based data from International Monetary Fund's Direction of Trade database.
Categorias:
Private Sector, Trade
Foi atualizado:
23 abr 2017 ano
Indicadores de alterações dos valores ao longo dos anos
Mínimo:
0.068
1 jan 2013 ano
Máximo:
44.147
1 jan 1989 ano
Na data de observação
Valor
Mudança absoluta
A alteração em relação ao valor anterior
1 jan 1961 ano
9.423
+9.423
0.0%
1 jan 1962 ano
10.753
+1.329
14.11%
1 jan 1963 ano
9.796
-0.957
-8.9%
1 jan 1964 ano
6.956
-2.84
-28.99%
1 jan 1965 ano
4.595
-2.361
-33.94%
1 jan 1966 ano
4.744
+0.149
3.24%
1 jan 1967 ano
5.171
+0.426
8.99%
1 jan 1968 ano
2.21
-2.96
-57.25%
1 jan 1969 ano
3.219
+1.009
45.63%
1 jan 1970 ano
3.908
+0.689
21.42%
1 jan 1971 ano
3.413
-0.496
-12.68%
1 jan 1972 ano
3.465
+0.052
1.53%
1 jan 1973 ano
1.61
-1.855
-53.55%
1 jan 1974 ano
2.075
+0.465
28.89%
1 jan 1975 ano
2.927
+0.852
41.08%
1 jan 1976 ano
2.647
-0.279
-9.55%
1 jan 1977 ano
2.026
-0.621
-23.47%
1 jan 1978 ano
2.932
+0.906
44.72%
1 jan 1979 ano
3.265
+0.333
11.37%
1 jan 1980 ano
2.617
-0.649
-19.86%
1 jan 1981 ano
2.637
+0.021
0.79%
1 jan 1982 ano
4.15
+1.513
57.35%
1 jan 1983 ano
10.46
+6.309
152.03%
1 jan 1984 ano
15.46
+5.001
47.81%
1 jan 1985 ano
24.754
+9.293
60.11%
1 jan 1986 ano
41.078
+16.325
65.95%
1 jan 1987 ano
41.514
+0.436
1.06%
1 jan 1988 ano
39.841
-1.673
-4.03%
1 jan 1989 ano
44.147
+4.306
10.81%
1 jan 1990 ano
36.359
-7.788
-17.64%
1 jan 1991 ano
20.522
-15.837
-43.56%
1 jan 1992 ano
9.053
-11.469
-55.88%
1 jan 1993 ano
7.421
-1.633
-18.03%
1 jan 1994 ano
5.946
-1.474
-19.87%
1 jan 1995 ano
11.287
+5.34
89.81%
1 jan 1996 ano
6.604
-4.683
-41.49%
1 jan 1997 ano
5.14
-1.464
-22.17%
1 jan 1998 ano
4.097
-1.043
-20.29%
1 jan 1999 ano
4.854
+0.756
18.46%
1 jan 2000 ano
5.581
+0.727
14.99%
1 jan 2001 ano
11.558
+5.978
107.11%
1 jan 2002 ano
11.917
+0.359
3.1%
1 jan 2003 ano
13.809
+1.891
15.87%
1 jan 2004 ano
0.497
-13.311
-96.4%
1 jan 2005 ano
0.264
-0.233
-46.88%
1 jan 2006 ano
0.252
-0.012
-4.65%
1 jan 2007 ano
0.695
+0.443
176.0%
1 jan 2008 ano
1.073
+0.378
54.43%
1 jan 2009 ano
1.468
+0.394
36.74%
1 jan 2010 ano
0.845
-0.623
-42.46%
1 jan 2011 ano
0.173
-0.672
-79.54%
1 jan 2012 ano
1.246
+1.073
620.89%
1 jan 2013 ano
0.068
-1.178
-94.56%
1 jan 2014 ano
0.1
+0.032
47.01%
1 jan 2015 ano
0.093
-0.007
-6.54%
Classificação de países por estatísticas atuais por anos


Comentários: