29
/pt/
pt
AIzaSyAYiBZKx7MnpbEhh9jyipgxe19OcubqV5w
April 1, 2024
76410
Bahamas, The
BHS
true
2
1
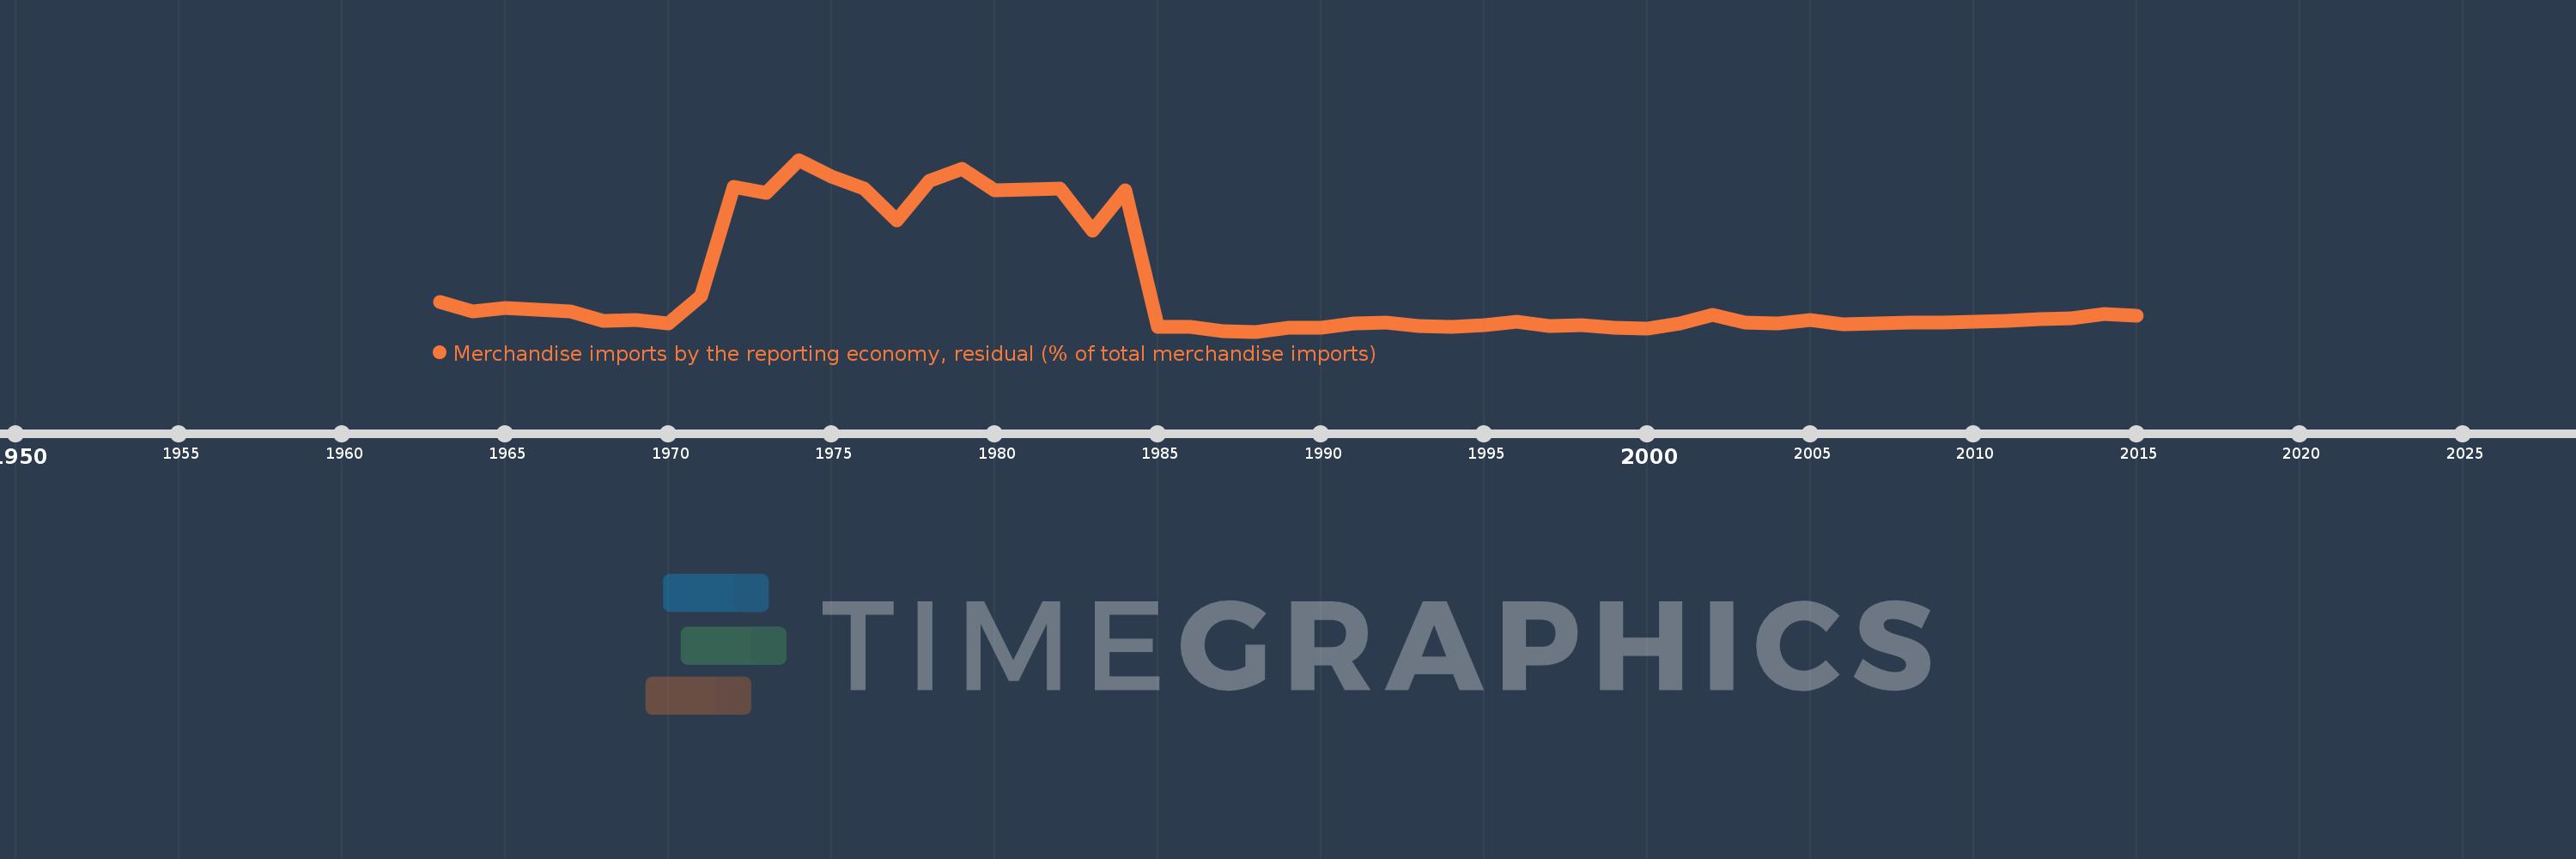
Merchandise imports by the reporting economy, residual (% of total merchandise imports)
2015,2014,2013,2012,2011,2010,2009,2008,2007,2006,2005,2004,2003,2002,2001,2000,1999,1998,1997,1996,1995,1994,1993,1992,1991,1990,1989,1988,1987,1986,1985,1984,1983,1982,1980,1979,1978,1977,1976,1975,1974,1973,1972,1971,1970,1969,1968,1967,1965,1964,1963
Estas estatísticas em outros países:
AfghanistanAlbaniaAlgeriaAmerican SamoaAngolaAntigua and BarbudaArab WorldArgentinaArmeniaArubaAustraliaAustriaAzerbaijanBahamas, TheBahrainBangladeshBarbadosBelarusBelgiumBelizeBeninBermudaBoliviaBosnia and HerzegovinaBrazilBrunei DarussalamBulgariaBurkina FasoBurundiCabo VerdeCambodiaCameroonCanadaCaribbean small statesCentral African RepublicCentral Europe and the BalticsChadChileChinaColombiaComorosCongo, Dem. Rep.Congo, Rep.Costa RicaCote d'IvoireCroatiaCubaCyprusCzech RepublicDenmarkDjiboutiDominicaDominican RepublicEarly-demographic dividendEast Asia & PacificEast Asia & Pacific (excluding high income)East Asia & Pacific (IDA & IBRD countries)EcuadorEgypt, Arab Rep.El SalvadorEquatorial GuineaEstoniaEthiopiaEuro areaEurope & Central AsiaEurope & Central Asia (excluding high income)Europe & Central Asia (IDA & IBRD countries)European UnionFaroe IslandsFijiFinlandFragile and conflict affected situationsFranceFrench PolynesiaGabonGambia, TheGeorgiaGermanyGhanaGibraltarGreeceGreenlandGrenadaGuamGuatemalaGuineaGuinea-BissauGuyanaHaitiHeavily indebted poor countries (HIPC)High incomeHondurasHong Kong SAR, ChinaHungaryIBRD onlyIcelandIDA & IBRD totalIDA blendIDA onlyIDA totalIndiaIndonesiaIran, Islamic Rep.IraqIrelandIsraelItalyJamaicaJapanJordanKazakhstanKenyaKiribatiKorea, Dem. People’s Rep.Korea, Rep.KosovoKuwaitKyrgyz RepublicLao PDRLate-demographic dividendLatin America & Caribbean Latin America & Caribbean (excluding high income)Latin America & the Caribbean (IDA & IBRD countries)LatviaLeast developed countries: UN classificationLebanonLiberiaLibyaLithuaniaLow & middle incomeLow incomeLower middle incomeLuxembourgMacao SAR, ChinaMacedonia, FYRMadagascarMalawiMalaysiaMaldivesMaliMaltaMauritaniaMauritiusMexicoMiddle East & North AfricaMiddle East & North Africa (excluding high income)Middle East & North Africa (IDA & IBRD countries)Middle incomeMoldovaMongoliaMontenegroMoroccoMozambiqueMyanmarNauruNepalNetherlandsNew CaledoniaNew ZealandNicaraguaNigerNigeriaNorth AmericaNorwayOECD membersOmanOther small statesPacific island small statesPakistanPanamaPapua New GuineaParaguayPeruPhilippinesPolandPortugalPost-demographic dividendPre-demographic dividendQatarRomaniaRussian FederationRwandaSamoaSao Tome and PrincipeSaudi ArabiaSenegalSerbiaSeychellesSierra LeoneSingaporeSlovak RepublicSloveniaSmall statesSolomon IslandsSomaliaSouth AfricaSouth AsiaSouth Asia (IDA & IBRD)SpainSri LankaSt. Kitts and NevisSt. LuciaSt. Vincent and the GrenadinesSub-Saharan Africa Sub-Saharan Africa (excluding high income)Sub-Saharan Africa (IDA & IBRD countries)SudanSurinameSwedenSwitzerlandSyrian Arab RepublicTajikistanTanzaniaThailandTogoTongaTrinidad and TobagoTunisiaTurkeyTurkmenistanTuvaluUgandaUkraineUnited Arab EmiratesUnited KingdomUnited StatesUpper middle incomeUruguayUzbekistanVanuatuVenezuela, RBVietnamWorldYemen, Rep.ZambiaZimbabwe Linha do tempo:
Nesta escala de tempo está apresentado um gráfico de 1963 ano até 2015 ano Bahamas, The. Dados de 1962 ano ausente. O número de observações reais por data: 51.
Fonte (nome):
Indicadores de desenvolvimento mundial
Fonte (organização):
World Bank staff estimates based data from International Monetary Fund's Direction of Trade database.
Categorias:
Private Sector, Trade
Foi atualizado:
23 abr 2017 ano
Indicadores de alterações dos valores ao longo dos anos
Mínimo:
0.702
1 jan 1988 ano
Máximo:
57.505
1 jan 1974 ano
Na data de observação
Valor
Mudança absoluta
A alteração em relação ao valor anterior
1 jan 1963 ano
10.641
+10.641
0.0%
1 jan 1964 ano
7.468
-3.173
-29.82%
1 jan 1965 ano
8.532
+1.063
14.24%
1 jan 1967 ano
7.381
-1.151
-13.49%
1 jan 1968 ano
4.277
-3.104
-42.05%
1 jan 1969 ano
4.621
+0.344
8.04%
1 jan 1970 ano
3.518
-1.103
-23.86%
1 jan 1971 ano
12.434
+8.916
253.45%
1 jan 1972 ano
48.52
+36.086
290.21%
1 jan 1973 ano
46.61
-1.911
-3.94%
1 jan 1974 ano
57.505
+10.896
23.38%
1 jan 1975 ano
51.943
-5.562
-9.67%
1 jan 1976 ano
48.113
-3.83
-7.37%
1 jan 1977 ano
37.572
-10.541
-21.91%
1 jan 1978 ano
50.534
+12.962
34.5%
1 jan 1979 ano
54.617
+4.082
8.08%
1 jan 1980 ano
47.33
-7.286
-13.34%
1 jan 1982 ano
48.012
+0.681
1.44%
1 jan 1983 ano
34.118
-13.893
-28.94%
1 jan 1984 ano
47.33
+13.212
38.72%
1 jan 1985 ano
2.368
-44.962
-95.0%
1 jan 1986 ano
2.303
-0.065
-2.73%
1 jan 1987 ano
0.815
-1.488
-64.62%
1 jan 1988 ano
0.702
-0.113
-13.88%
1 jan 1989 ano
1.958
+1.256
178.92%
1 jan 1990 ano
1.844
-0.114
-5.83%
1 jan 1991 ano
3.469
+1.625
88.14%
1 jan 1992 ano
3.559
+0.091
2.62%
1 jan 1993 ano
2.612
-0.948
-26.63%
1 jan 1994 ano
2.206
-0.406
-15.53%
1 jan 1995 ano
2.745
+0.539
24.41%
1 jan 1996 ano
3.95
+1.206
43.93%
1 jan 1997 ano
2.654
-1.296
-32.81%
1 jan 1998 ano
2.835
+0.18
6.79%
1 jan 1999 ano
1.875
-0.959
-33.84%
1 jan 2000 ano
1.729
-0.147
-7.82%
1 jan 2001 ano
3.506
+1.777
102.82%
1 jan 2002 ano
6.204
+2.697
76.93%
1 jan 2003 ano
3.749
-2.455
-39.57%
1 jan 2004 ano
3.492
-0.256
-6.84%
1 jan 2005 ano
4.613
+1.121
32.1%
1 jan 2006 ano
3.17
-1.444
-31.3%
1 jan 2007 ano
3.269
+0.099
3.13%
1 jan 2008 ano
3.775
+0.506
15.49%
1 jan 2009 ano
3.674
-0.101
-2.68%
1 jan 2010 ano
3.83
+0.156
4.24%
1 jan 2011 ano
4.179
+0.349
9.12%
1 jan 2012 ano
4.69
+0.511
12.22%
1 jan 2013 ano
5.1
+0.411
8.76%
1 jan 2014 ano
6.499
+1.399
27.42%
1 jan 2015 ano
6.057
-0.442
-6.8%
Classificação de países por estatísticas atuais por anos


Comentários: