29
/pt/
pt
AIzaSyAYiBZKx7MnpbEhh9jyipgxe19OcubqV5w
April 1, 2024
26727
Early-demographic dividend
EAR
false
2
1
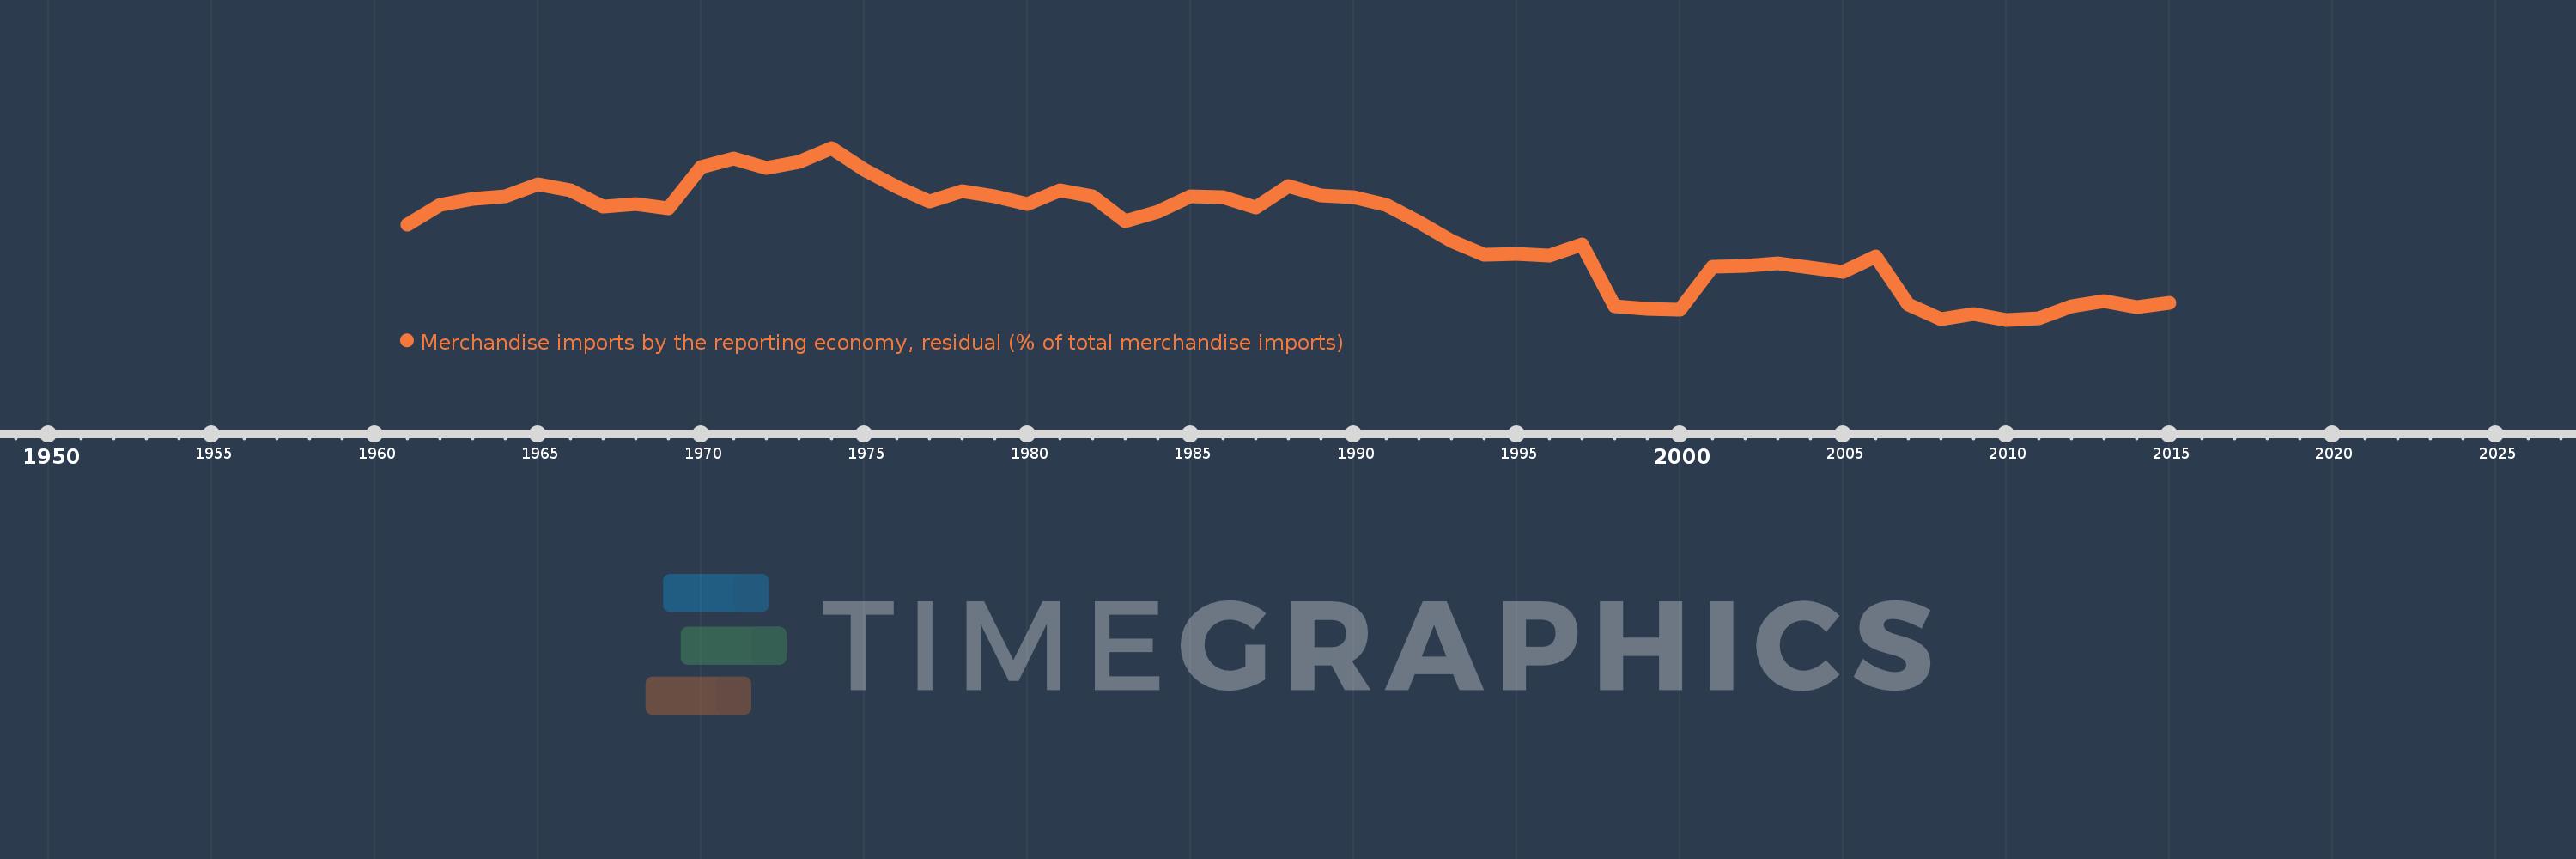
Merchandise imports by the reporting economy, residual (% of total merchandise imports)
2015,2014,2013,2012,2011,2010,2009,2008,2007,2006,2005,2004,2003,2002,2001,2000,1999,1998,1997,1996,1995,1994,1993,1992,1991,1990,1989,1988,1987,1986,1985,1984,1983,1982,1981,1980,1979,1978,1977,1976,1975,1974,1973,1972,1971,1970,1969,1968,1967,1966,1965,1964,1963,1962,1961
Estas estatísticas em outros países:
AfghanistanAlbaniaAlgeriaAmerican SamoaAngolaAntigua and BarbudaArab WorldArgentinaArmeniaArubaAustraliaAustriaAzerbaijanBahamas, TheBahrainBangladeshBarbadosBelarusBelgiumBelizeBeninBermudaBoliviaBosnia and HerzegovinaBrazilBrunei DarussalamBulgariaBurkina FasoBurundiCabo VerdeCambodiaCameroonCanadaCaribbean small statesCentral African RepublicCentral Europe and the BalticsChadChileChinaColombiaComorosCongo, Dem. Rep.Congo, Rep.Costa RicaCote d'IvoireCroatiaCubaCyprusCzech RepublicDenmarkDjiboutiDominicaDominican RepublicEarly-demographic dividendEast Asia & PacificEast Asia & Pacific (excluding high income)East Asia & Pacific (IDA & IBRD countries)EcuadorEgypt, Arab Rep.El SalvadorEquatorial GuineaEstoniaEthiopiaEuro areaEurope & Central AsiaEurope & Central Asia (excluding high income)Europe & Central Asia (IDA & IBRD countries)European UnionFaroe IslandsFijiFinlandFragile and conflict affected situationsFranceFrench PolynesiaGabonGambia, TheGeorgiaGermanyGhanaGibraltarGreeceGreenlandGrenadaGuamGuatemalaGuineaGuinea-BissauGuyanaHaitiHeavily indebted poor countries (HIPC)High incomeHondurasHong Kong SAR, ChinaHungaryIBRD onlyIcelandIDA & IBRD totalIDA blendIDA onlyIDA totalIndiaIndonesiaIran, Islamic Rep.IraqIrelandIsraelItalyJamaicaJapanJordanKazakhstanKenyaKiribatiKorea, Dem. People’s Rep.Korea, Rep.KosovoKuwaitKyrgyz RepublicLao PDRLate-demographic dividendLatin America & Caribbean Latin America & Caribbean (excluding high income)Latin America & the Caribbean (IDA & IBRD countries)LatviaLeast developed countries: UN classificationLebanonLiberiaLibyaLithuaniaLow & middle incomeLow incomeLower middle incomeLuxembourgMacao SAR, ChinaMacedonia, FYRMadagascarMalawiMalaysiaMaldivesMaliMaltaMauritaniaMauritiusMexicoMiddle East & North AfricaMiddle East & North Africa (excluding high income)Middle East & North Africa (IDA & IBRD countries)Middle incomeMoldovaMongoliaMontenegroMoroccoMozambiqueMyanmarNauruNepalNetherlandsNew CaledoniaNew ZealandNicaraguaNigerNigeriaNorth AmericaNorwayOECD membersOmanOther small statesPacific island small statesPakistanPanamaPapua New GuineaParaguayPeruPhilippinesPolandPortugalPost-demographic dividendPre-demographic dividendQatarRomaniaRussian FederationRwandaSamoaSao Tome and PrincipeSaudi ArabiaSenegalSerbiaSeychellesSierra LeoneSingaporeSlovak RepublicSloveniaSmall statesSolomon IslandsSomaliaSouth AfricaSouth AsiaSouth Asia (IDA & IBRD)SpainSri LankaSt. Kitts and NevisSt. LuciaSt. Vincent and the GrenadinesSub-Saharan Africa Sub-Saharan Africa (excluding high income)Sub-Saharan Africa (IDA & IBRD countries)SudanSurinameSwedenSwitzerlandSyrian Arab RepublicTajikistanTanzaniaThailandTogoTongaTrinidad and TobagoTunisiaTurkeyTurkmenistanTuvaluUgandaUkraineUnited Arab EmiratesUnited KingdomUnited StatesUpper middle incomeUruguayUzbekistanVanuatuVenezuela, RBVietnamWorldYemen, Rep.ZambiaZimbabwe Linha do tempo:
Nesta escala de tempo está apresentado um gráfico de 1961 ano até 2015 ano Early-demographic dividend. Dados de 1960 ano ausente. O número de observações reais por data: 55.
Fonte (nome):
Indicadores de desenvolvimento mundial
Fonte (organização):
World Bank staff estimates based data from International Monetary Fund's Direction of Trade database.
Categorias:
Private Sector, Trade
Foi atualizado:
23 abr 2017 ano
Indicadores de alterações dos valores ao longo dos anos
Mínimo:
2.283
1 jan 2010 ano
Máximo:
12.191
1 jan 1974 ano
Na data de observação
Valor
Mudança absoluta
A alteração em relação ao valor anterior
1 jan 1961 ano
7.749
+7.749
0.0%
1 jan 1962 ano
8.927
+1.178
15.21%
1 jan 1963 ano
9.234
+0.307
3.44%
1 jan 1964 ano
9.42
+0.186
2.01%
1 jan 1965 ano
10.11
+0.691
7.33%
1 jan 1966 ano
9.737
-0.374
-3.7%
1 jan 1967 ano
8.811
-0.926
-9.51%
1 jan 1968 ano
8.943
+0.133
1.51%
1 jan 1969 ano
8.717
-0.226
-2.53%
1 jan 1970 ano
11.07
+2.353
26.99%
1 jan 1971 ano
11.569
+0.499
4.51%
1 jan 1972 ano
11.012
-0.557
-4.81%
1 jan 1973 ano
11.381
+0.369
3.35%
1 jan 1974 ano
12.191
+0.81
7.12%
1 jan 1975 ano
10.926
-1.264
-10.37%
1 jan 1976 ano
9.952
-0.974
-8.91%
1 jan 1977 ano
9.122
-0.831
-8.35%
1 jan 1978 ano
9.701
+0.579
6.35%
1 jan 1979 ano
9.378
-0.323
-3.33%
1 jan 1980 ano
8.944
-0.435
-4.63%
1 jan 1981 ano
9.741
+0.797
8.91%
1 jan 1982 ano
9.388
-0.353
-3.62%
1 jan 1983 ano
7.972
-1.416
-15.08%
1 jan 1984 ano
8.53
+0.558
7.0%
1 jan 1985 ano
9.389
+0.859
10.08%
1 jan 1986 ano
9.332
-0.057
-0.61%
1 jan 1987 ano
8.76
-0.572
-6.13%
1 jan 1988 ano
10.01
+1.251
14.28%
1 jan 1989 ano
9.46
-0.55
-5.49%
1 jan 1990 ano
9.344
-0.116
-1.22%
1 jan 1991 ano
8.903
-0.441
-4.72%
1 jan 1992 ano
7.914
-0.989
-11.11%
1 jan 1993 ano
6.829
-1.084
-13.7%
1 jan 1994 ano
6.04
-0.79
-11.56%
1 jan 1995 ano
6.059
+0.019
0.32%
1 jan 1996 ano
5.972
-0.087
-1.43%
1 jan 1997 ano
6.607
+0.635
10.63%
1 jan 1998 ano
3.071
-3.536
-53.52%
1 jan 1999 ano
2.909
-0.162
-5.29%
1 jan 2000 ano
2.876
-0.033
-1.13%
1 jan 2001 ano
5.342
+2.466
85.74%
1 jan 2002 ano
5.393
+0.051
0.95%
1 jan 2003 ano
5.526
+0.133
2.47%
1 jan 2004 ano
5.306
-0.22
-3.98%
1 jan 2005 ano
5.025
-0.282
-5.31%
1 jan 2006 ano
5.958
+0.934
18.59%
1 jan 2007 ano
3.17
-2.789
-46.8%
1 jan 2008 ano
2.323
-0.847
-26.71%
1 jan 2009 ano
2.631
+0.307
13.23%
1 jan 2010 ano
2.283
-0.348
-13.22%
1 jan 2011 ano
2.356
+0.073
3.2%
1 jan 2012 ano
3.074
+0.718
30.48%
1 jan 2013 ano
3.341
+0.267
8.7%
1 jan 2014 ano
3.026
-0.315
-9.42%
1 jan 2015 ano
3.28
+0.253
8.38%
Classificação de países por estatísticas atuais por anos


Comentários: