29
/pt/
pt
AIzaSyAYiBZKx7MnpbEhh9jyipgxe19OcubqV5w
April 1, 2024
27480
East Asia & Pacific
EAS
false
2
1
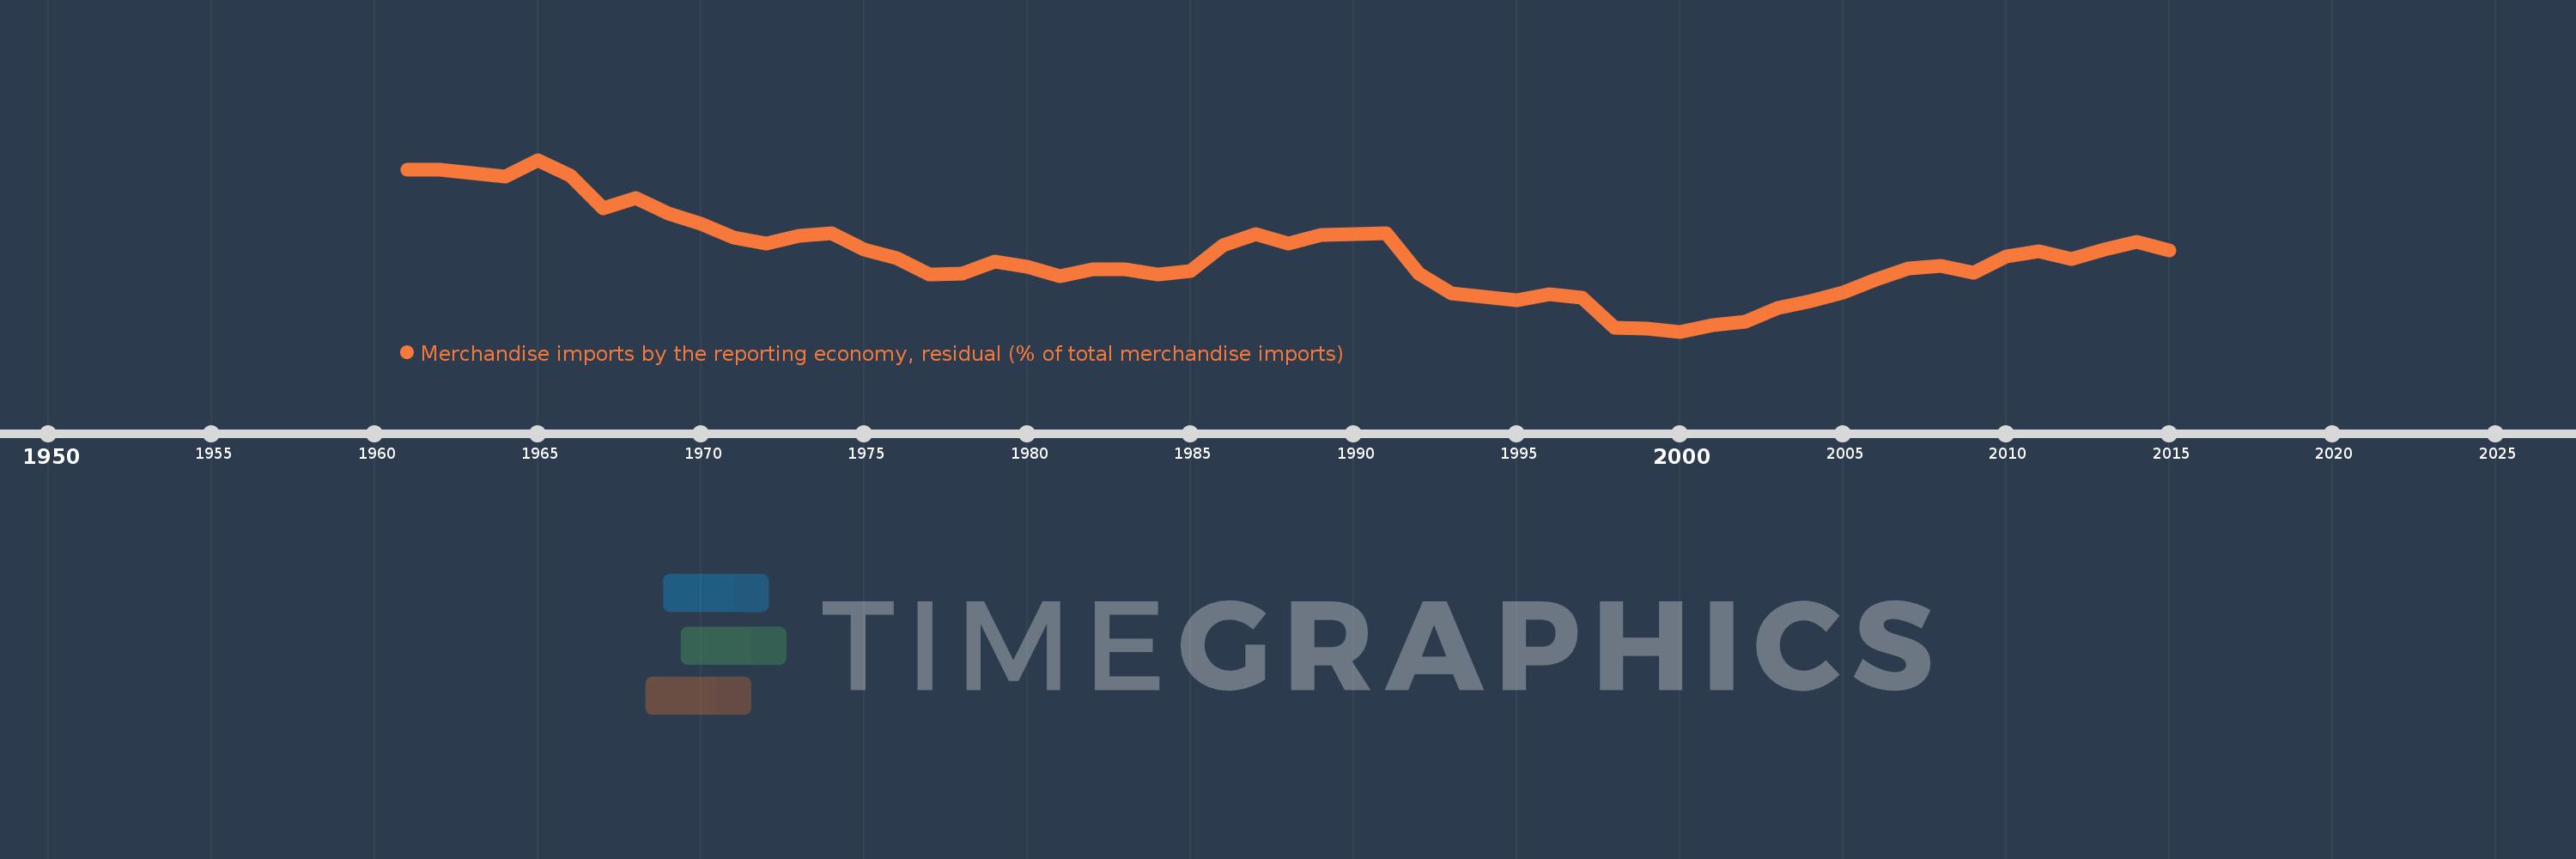
Merchandise imports by the reporting economy, residual (% of total merchandise imports)
2015,2014,2013,2012,2011,2010,2009,2008,2007,2006,2005,2004,2003,2002,2001,2000,1999,1998,1997,1996,1995,1994,1993,1992,1991,1990,1989,1988,1987,1986,1985,1984,1983,1982,1981,1980,1979,1978,1977,1976,1975,1974,1973,1972,1971,1970,1969,1968,1967,1966,1965,1964,1963,1962,1961
Estas estatísticas em outros países:
AfghanistanAlbaniaAlgeriaAmerican SamoaAngolaAntigua and BarbudaArab WorldArgentinaArmeniaArubaAustraliaAustriaAzerbaijanBahamas, TheBahrainBangladeshBarbadosBelarusBelgiumBelizeBeninBermudaBoliviaBosnia and HerzegovinaBrazilBrunei DarussalamBulgariaBurkina FasoBurundiCabo VerdeCambodiaCameroonCanadaCaribbean small statesCentral African RepublicCentral Europe and the BalticsChadChileChinaColombiaComorosCongo, Dem. Rep.Congo, Rep.Costa RicaCote d'IvoireCroatiaCubaCyprusCzech RepublicDenmarkDjiboutiDominicaDominican RepublicEarly-demographic dividendEast Asia & PacificEast Asia & Pacific (excluding high income)East Asia & Pacific (IDA & IBRD countries)EcuadorEgypt, Arab Rep.El SalvadorEquatorial GuineaEstoniaEthiopiaEuro areaEurope & Central AsiaEurope & Central Asia (excluding high income)Europe & Central Asia (IDA & IBRD countries)European UnionFaroe IslandsFijiFinlandFragile and conflict affected situationsFranceFrench PolynesiaGabonGambia, TheGeorgiaGermanyGhanaGibraltarGreeceGreenlandGrenadaGuamGuatemalaGuineaGuinea-BissauGuyanaHaitiHeavily indebted poor countries (HIPC)High incomeHondurasHong Kong SAR, ChinaHungaryIBRD onlyIcelandIDA & IBRD totalIDA blendIDA onlyIDA totalIndiaIndonesiaIran, Islamic Rep.IraqIrelandIsraelItalyJamaicaJapanJordanKazakhstanKenyaKiribatiKorea, Dem. People’s Rep.Korea, Rep.KosovoKuwaitKyrgyz RepublicLao PDRLate-demographic dividendLatin America & Caribbean Latin America & Caribbean (excluding high income)Latin America & the Caribbean (IDA & IBRD countries)LatviaLeast developed countries: UN classificationLebanonLiberiaLibyaLithuaniaLow & middle incomeLow incomeLower middle incomeLuxembourgMacao SAR, ChinaMacedonia, FYRMadagascarMalawiMalaysiaMaldivesMaliMaltaMauritaniaMauritiusMexicoMiddle East & North AfricaMiddle East & North Africa (excluding high income)Middle East & North Africa (IDA & IBRD countries)Middle incomeMoldovaMongoliaMontenegroMoroccoMozambiqueMyanmarNauruNepalNetherlandsNew CaledoniaNew ZealandNicaraguaNigerNigeriaNorth AmericaNorwayOECD membersOmanOther small statesPacific island small statesPakistanPanamaPapua New GuineaParaguayPeruPhilippinesPolandPortugalPost-demographic dividendPre-demographic dividendQatarRomaniaRussian FederationRwandaSamoaSao Tome and PrincipeSaudi ArabiaSenegalSerbiaSeychellesSierra LeoneSingaporeSlovak RepublicSloveniaSmall statesSolomon IslandsSomaliaSouth AfricaSouth AsiaSouth Asia (IDA & IBRD)SpainSri LankaSt. Kitts and NevisSt. LuciaSt. Vincent and the GrenadinesSub-Saharan Africa Sub-Saharan Africa (excluding high income)Sub-Saharan Africa (IDA & IBRD countries)SudanSurinameSwedenSwitzerlandSyrian Arab RepublicTajikistanTanzaniaThailandTogoTongaTrinidad and TobagoTunisiaTurkeyTurkmenistanTuvaluUgandaUkraineUnited Arab EmiratesUnited KingdomUnited StatesUpper middle incomeUruguayUzbekistanVanuatuVenezuela, RBVietnamWorldYemen, Rep.ZambiaZimbabwe Linha do tempo:
Nesta escala de tempo está apresentado um gráfico de 1961 ano até 2015 ano East Asia & Pacific. Dados de 1960 ano ausente. O número de observações reais por data: 55.
Fonte (nome):
Indicadores de desenvolvimento mundial
Fonte (organização):
World Bank staff estimates based data from International Monetary Fund's Direction of Trade database.
Categorias:
Private Sector, Trade
Foi atualizado:
23 abr 2017 ano
Indicadores de alterações dos valores ao longo dos anos
Mínimo:
0.75
1 jan 2000 ano
Máximo:
6.127
1 jan 1965 ano
Na data de observação
Valor
Mudança absoluta
A alteração em relação ao valor anterior
1 jan 1961 ano
5.826
+5.826
0.0%
1 jan 1962 ano
5.823
-0.003
-0.05%
1 jan 1963 ano
5.717
-0.107
-1.83%
1 jan 1964 ano
5.595
-0.121
-2.12%
1 jan 1965 ano
6.127
+0.532
9.5%
1 jan 1966 ano
5.633
-0.494
-8.06%
1 jan 1967 ano
4.621
-1.012
-17.97%
1 jan 1968 ano
4.925
+0.304
6.59%
1 jan 1969 ano
4.436
-0.49
-9.94%
1 jan 1970 ano
4.113
-0.322
-7.26%
1 jan 1971 ano
3.69
-0.423
-10.29%
1 jan 1972 ano
3.498
-0.192
-5.21%
1 jan 1973 ano
3.76
+0.262
7.49%
1 jan 1974 ano
3.826
+0.066
1.76%
1 jan 1975 ano
3.33
-0.496
-12.97%
1 jan 1976 ano
3.037
-0.293
-8.79%
1 jan 1977 ano
2.54
-0.497
-16.36%
1 jan 1978 ano
2.559
+0.019
0.76%
1 jan 1979 ano
2.954
+0.394
15.4%
1 jan 1980 ano
2.783
-0.17
-5.76%
1 jan 1981 ano
2.488
-0.295
-10.61%
1 jan 1982 ano
2.709
+0.221
8.87%
1 jan 1983 ano
2.699
-0.009
-0.35%
1 jan 1984 ano
2.548
-0.151
-5.6%
1 jan 1985 ano
2.652
+0.104
4.08%
1 jan 1986 ano
3.439
+0.787
29.67%
1 jan 1987 ano
3.811
+0.371
10.8%
1 jan 1988 ano
3.511
-0.3
-7.87%
1 jan 1989 ano
3.771
+0.26
7.41%
1 jan 1990 ano
3.804
+0.033
0.88%
1 jan 1991 ano
3.823
+0.019
0.5%
1 jan 1992 ano
2.572
-1.252
-32.74%
1 jan 1993 ano
1.94
-0.631
-24.55%
1 jan 1994 ano
1.845
-0.096
-4.93%
1 jan 1995 ano
1.741
-0.104
-5.64%
1 jan 1996 ano
1.927
+0.186
10.7%
1 jan 1997 ano
1.808
-0.119
-6.19%
1 jan 1998 ano
0.868
-0.94
-52.0%
1 jan 1999 ano
0.846
-0.022
-2.5%
1 jan 2000 ano
0.75
-0.096
-11.32%
1 jan 2001 ano
0.941
+0.19
25.37%
1 jan 2002 ano
1.057
+0.116
12.36%
1 jan 2003 ano
1.479
+0.422
39.91%
1 jan 2004 ano
1.703
+0.224
15.16%
1 jan 2005 ano
1.96
+0.257
15.08%
1 jan 2006 ano
2.385
+0.426
21.72%
1 jan 2007 ano
2.714
+0.329
13.78%
1 jan 2008 ano
2.8
+0.086
3.18%
1 jan 2009 ano
2.591
-0.209
-7.47%
1 jan 2010 ano
3.096
+0.505
19.5%
1 jan 2011 ano
3.276
+0.179
5.79%
1 jan 2012 ano
3.033
-0.243
-7.41%
1 jan 2013 ano
3.318
+0.285
9.39%
1 jan 2014 ano
3.565
+0.247
7.45%
1 jan 2015 ano
3.28
-0.285
-7.99%
Classificação de países por estatísticas atuais por anos


Comentários: