29
/pt/
pt
AIzaSyAYiBZKx7MnpbEhh9jyipgxe19OcubqV5w
April 1, 2024
32824
Europe & Central Asia (IDA & IBRD countries)
TEC
false
2
1
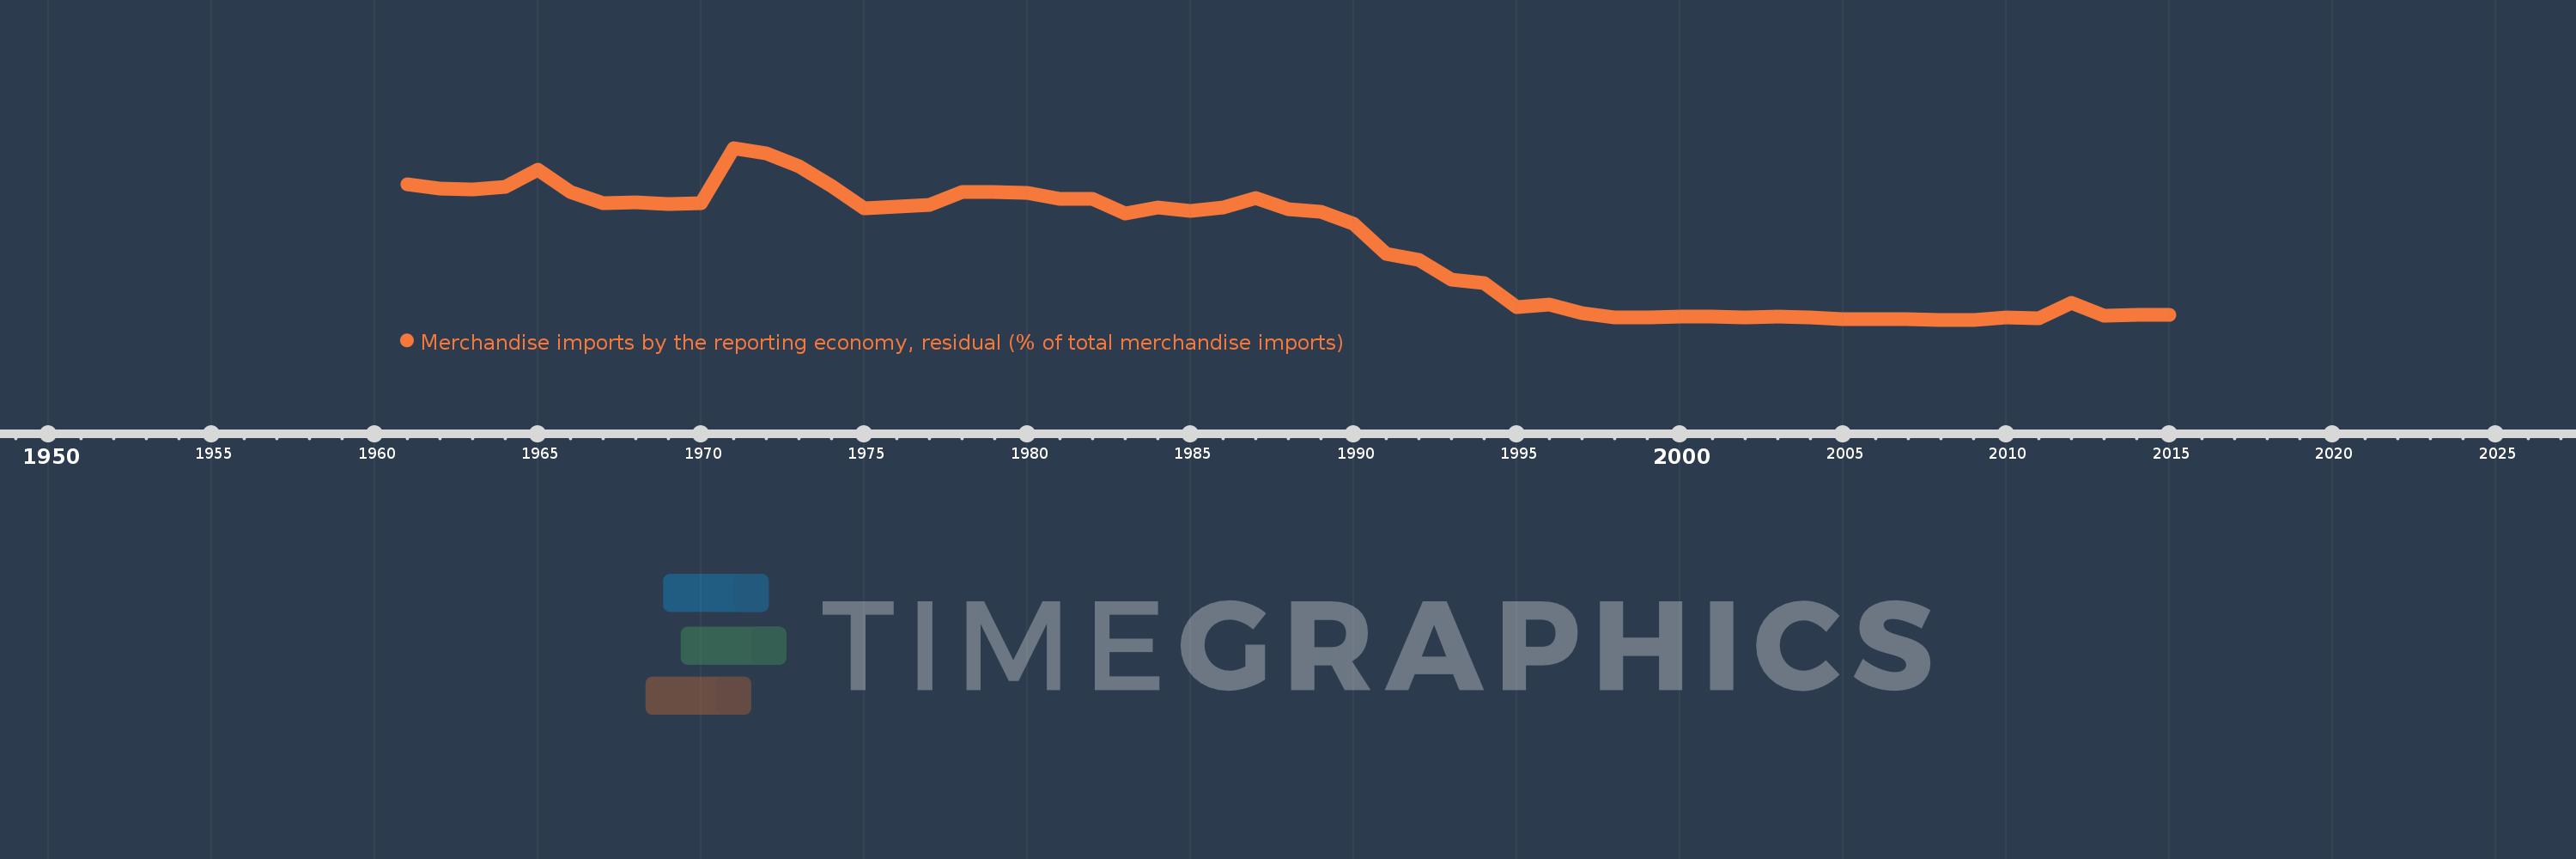
Merchandise imports by the reporting economy, residual (% of total merchandise imports)
2015,2014,2013,2012,2011,2010,2009,2008,2007,2006,2005,2004,2003,2002,2001,2000,1999,1998,1997,1996,1995,1994,1993,1992,1991,1990,1989,1988,1987,1986,1985,1984,1983,1982,1981,1980,1979,1978,1977,1976,1975,1974,1973,1972,1971,1970,1969,1968,1967,1966,1965,1964,1963,1962,1961
Estas estatísticas em outros países:
AfghanistanAlbaniaAlgeriaAmerican SamoaAngolaAntigua and BarbudaArab WorldArgentinaArmeniaArubaAustraliaAustriaAzerbaijanBahamas, TheBahrainBangladeshBarbadosBelarusBelgiumBelizeBeninBermudaBoliviaBosnia and HerzegovinaBrazilBrunei DarussalamBulgariaBurkina FasoBurundiCabo VerdeCambodiaCameroonCanadaCaribbean small statesCentral African RepublicCentral Europe and the BalticsChadChileChinaColombiaComorosCongo, Dem. Rep.Congo, Rep.Costa RicaCote d'IvoireCroatiaCubaCyprusCzech RepublicDenmarkDjiboutiDominicaDominican RepublicEarly-demographic dividendEast Asia & PacificEast Asia & Pacific (excluding high income)East Asia & Pacific (IDA & IBRD countries)EcuadorEgypt, Arab Rep.El SalvadorEquatorial GuineaEstoniaEthiopiaEuro areaEurope & Central AsiaEurope & Central Asia (excluding high income)Europe & Central Asia (IDA & IBRD countries)European UnionFaroe IslandsFijiFinlandFragile and conflict affected situationsFranceFrench PolynesiaGabonGambia, TheGeorgiaGermanyGhanaGibraltarGreeceGreenlandGrenadaGuamGuatemalaGuineaGuinea-BissauGuyanaHaitiHeavily indebted poor countries (HIPC)High incomeHondurasHong Kong SAR, ChinaHungaryIBRD onlyIcelandIDA & IBRD totalIDA blendIDA onlyIDA totalIndiaIndonesiaIran, Islamic Rep.IraqIrelandIsraelItalyJamaicaJapanJordanKazakhstanKenyaKiribatiKorea, Dem. People’s Rep.Korea, Rep.KosovoKuwaitKyrgyz RepublicLao PDRLate-demographic dividendLatin America & Caribbean Latin America & Caribbean (excluding high income)Latin America & the Caribbean (IDA & IBRD countries)LatviaLeast developed countries: UN classificationLebanonLiberiaLibyaLithuaniaLow & middle incomeLow incomeLower middle incomeLuxembourgMacao SAR, ChinaMacedonia, FYRMadagascarMalawiMalaysiaMaldivesMaliMaltaMauritaniaMauritiusMexicoMiddle East & North AfricaMiddle East & North Africa (excluding high income)Middle East & North Africa (IDA & IBRD countries)Middle incomeMoldovaMongoliaMontenegroMoroccoMozambiqueMyanmarNauruNepalNetherlandsNew CaledoniaNew ZealandNicaraguaNigerNigeriaNorth AmericaNorwayOECD membersOmanOther small statesPacific island small statesPakistanPanamaPapua New GuineaParaguayPeruPhilippinesPolandPortugalPost-demographic dividendPre-demographic dividendQatarRomaniaRussian FederationRwandaSamoaSao Tome and PrincipeSaudi ArabiaSenegalSerbiaSeychellesSierra LeoneSingaporeSlovak RepublicSloveniaSmall statesSolomon IslandsSomaliaSouth AfricaSouth AsiaSouth Asia (IDA & IBRD)SpainSri LankaSt. Kitts and NevisSt. LuciaSt. Vincent and the GrenadinesSub-Saharan Africa Sub-Saharan Africa (excluding high income)Sub-Saharan Africa (IDA & IBRD countries)SudanSurinameSwedenSwitzerlandSyrian Arab RepublicTajikistanTanzaniaThailandTogoTongaTrinidad and TobagoTunisiaTurkeyTurkmenistanTuvaluUgandaUkraineUnited Arab EmiratesUnited KingdomUnited StatesUpper middle incomeUruguayUzbekistanVanuatuVenezuela, RBVietnamWorldYemen, Rep.ZambiaZimbabwe Linha do tempo:
Nesta escala de tempo está apresentado um gráfico de 1961 ano até 2015 ano Europe & Central Asia (IDA & IBRD countries). Dados de 1960 ano ausente. O número de observações reais por data: 55.
Fonte (nome):
Indicadores de desenvolvimento mundial
Fonte (organização):
World Bank staff estimates based data from International Monetary Fund's Direction of Trade database.
Categorias:
Private Sector, Trade
Foi atualizado:
23 abr 2017 ano
Indicadores de alterações dos valores ao longo dos anos
Mínimo:
0.784
1 jan 2009 ano
Máximo:
52.174
1 jan 1971 ano
Na data de observação
Valor
Mudança absoluta
A alteração em relação ao valor anterior
1 jan 1961 ano
41.369
+41.369
0.0%
1 jan 1962 ano
40.126
-1.243
-3.0%
1 jan 1963 ano
39.68
-0.446
-1.11%
1 jan 1964 ano
40.406
+0.726
1.83%
1 jan 1965 ano
45.592
+5.185
12.83%
1 jan 1966 ano
39.071
-6.521
-14.3%
1 jan 1967 ano
35.652
-3.419
-8.75%
1 jan 1968 ano
35.945
+0.293
0.82%
1 jan 1969 ano
35.518
-0.427
-1.19%
1 jan 1970 ano
35.646
+0.128
0.36%
1 jan 1971 ano
52.174
+16.528
46.37%
1 jan 1972 ano
50.451
-1.724
-3.3%
1 jan 1973 ano
46.651
-3.8
-7.53%
1 jan 1974 ano
40.794
-5.857
-12.56%
1 jan 1975 ano
34.085
-6.708
-16.44%
1 jan 1976 ano
34.722
+0.636
1.87%
1 jan 1977 ano
35.192
+0.471
1.36%
1 jan 1978 ano
38.878
+3.686
10.47%
1 jan 1979 ano
38.971
+0.093
0.24%
1 jan 1980 ano
38.717
-0.254
-0.65%
1 jan 1981 ano
36.914
-1.803
-4.66%
1 jan 1982 ano
36.898
-0.017
-0.04%
1 jan 1983 ano
32.639
-4.259
-11.54%
1 jan 1984 ano
34.465
+1.826
5.59%
1 jan 1985 ano
33.45
-1.015
-2.94%
1 jan 1986 ano
34.289
+0.839
2.51%
1 jan 1987 ano
37.184
+2.895
8.44%
1 jan 1988 ano
33.904
-3.28
-8.82%
1 jan 1989 ano
33.02
-0.885
-2.61%
1 jan 1990 ano
29.53
-3.49
-10.57%
1 jan 1991 ano
20.59
-8.94
-30.28%
1 jan 1992 ano
18.712
-1.878
-9.12%
1 jan 1993 ano
12.697
-6.015
-32.15%
1 jan 1994 ano
11.644
-1.053
-8.29%
1 jan 1995 ano
4.595
-7.049
-60.54%
1 jan 1996 ano
5.298
+0.703
15.29%
1 jan 1997 ano
2.882
-2.415
-45.59%
1 jan 1998 ano
1.363
-1.52
-52.73%
1 jan 1999 ano
1.413
+0.05
3.7%
1 jan 2000 ano
1.832
+0.419
29.68%
1 jan 2001 ano
1.638
-0.195
-10.63%
1 jan 2002 ano
1.38
-0.258
-15.75%
1 jan 2003 ano
1.613
+0.234
16.95%
1 jan 2004 ano
1.475
-0.139
-8.6%
1 jan 2005 ano
0.841
-0.633
-42.95%
1 jan 2006 ano
0.846
+0.005
0.58%
1 jan 2007 ano
0.972
+0.126
14.87%
1 jan 2008 ano
0.797
-0.175
-17.96%
1 jan 2009 ano
0.784
-0.014
-1.73%
1 jan 2010 ano
1.496
+0.712
90.85%
1 jan 2011 ano
1.348
-0.148
-9.87%
1 jan 2012 ano
5.781
+4.433
328.87%
1 jan 2013 ano
2.021
-3.76
-65.04%
1 jan 2014 ano
2.155
+0.135
6.66%
1 jan 2015 ano
2.346
+0.191
8.85%
Classificação de países por estatísticas atuais por anos


Comentários: