29
/pt/
pt
AIzaSyAYiBZKx7MnpbEhh9jyipgxe19OcubqV5w
April 1, 2024
269624
Turkey
TUR
true
2
1
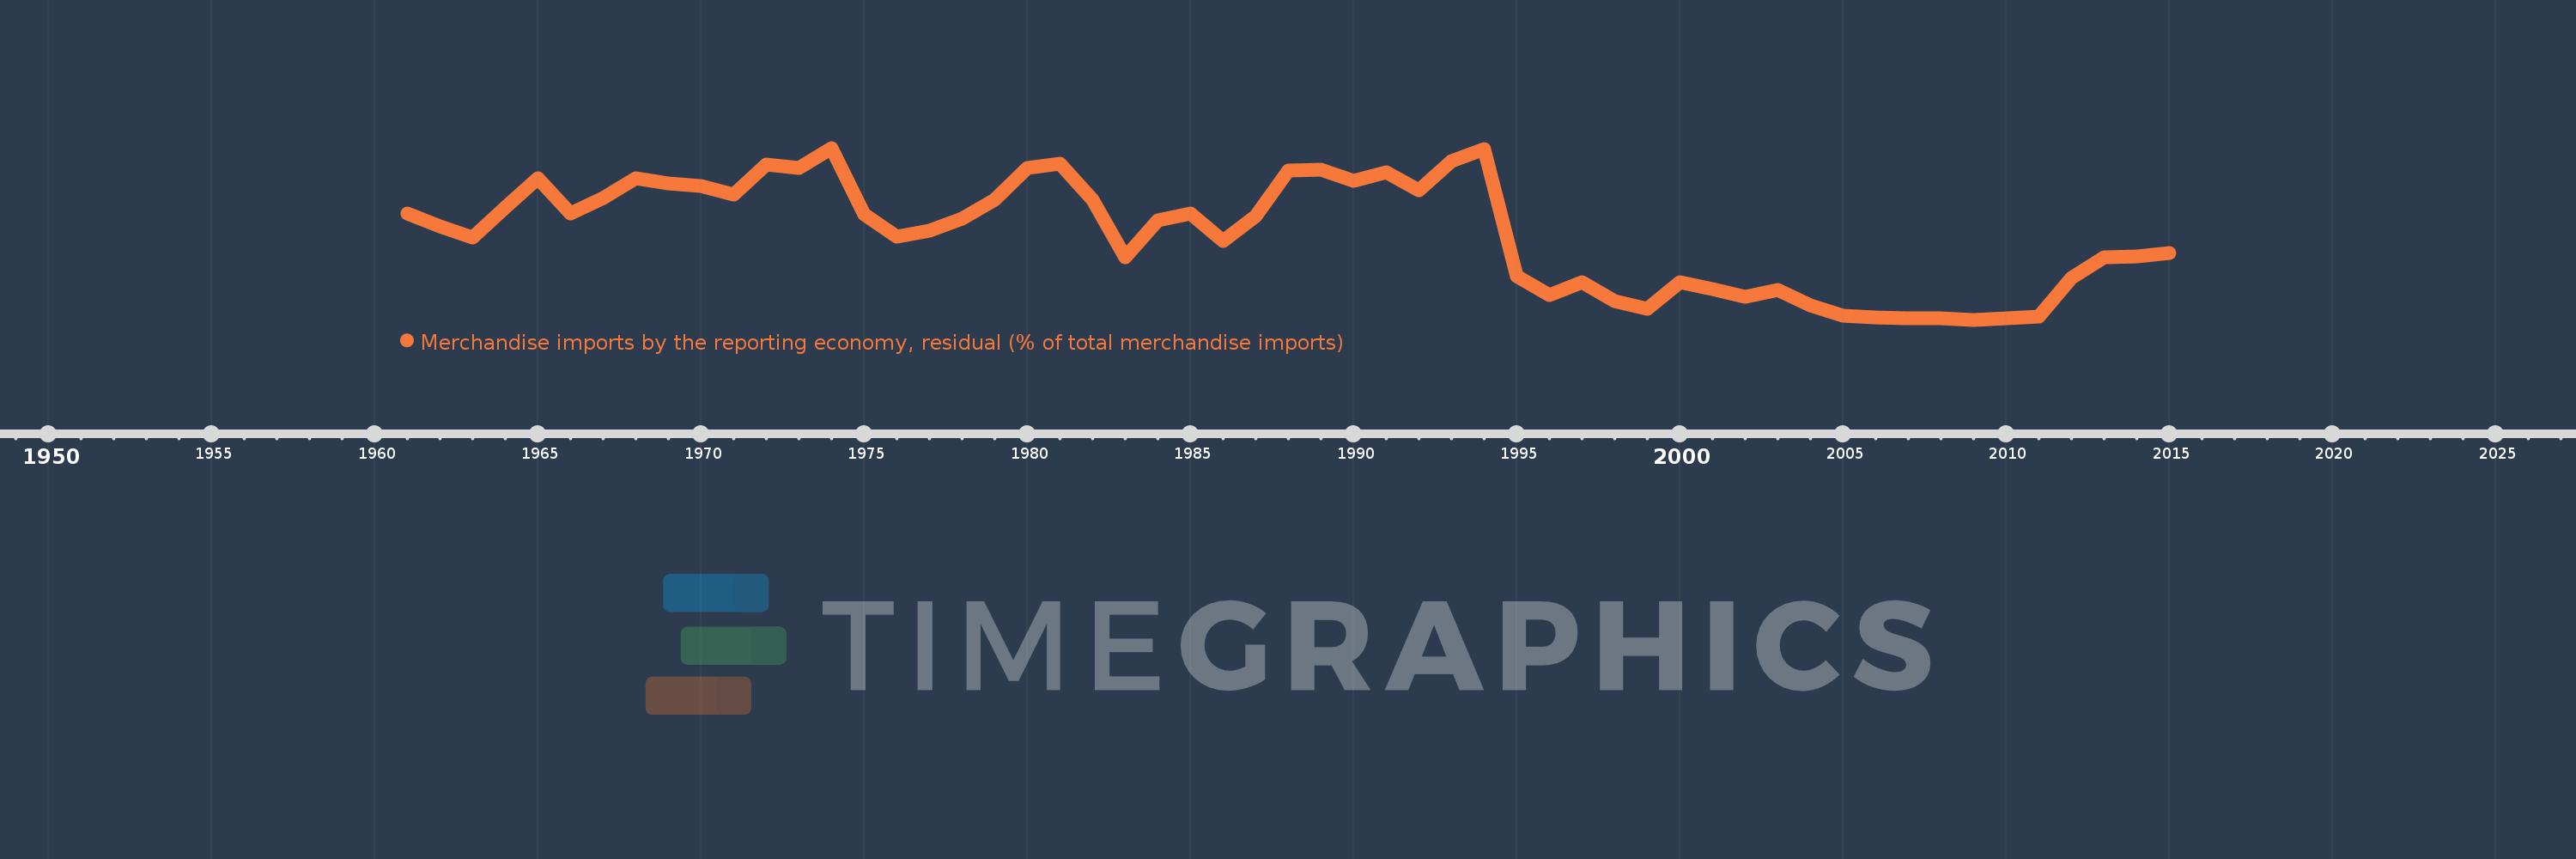
Merchandise imports by the reporting economy, residual (% of total merchandise imports)
2015,2014,2013,2012,2011,2010,2009,2008,2007,2006,2005,2004,2003,2002,2001,2000,1999,1998,1997,1996,1995,1994,1993,1992,1991,1990,1989,1988,1987,1986,1985,1984,1983,1982,1981,1980,1979,1978,1977,1976,1975,1974,1973,1972,1971,1970,1969,1968,1967,1966,1965,1964,1963,1962,1961
Estas estatísticas em outros países:
AfghanistanAlbaniaAlgeriaAmerican SamoaAngolaAntigua and BarbudaArab WorldArgentinaArmeniaArubaAustraliaAustriaAzerbaijanBahamas, TheBahrainBangladeshBarbadosBelarusBelgiumBelizeBeninBermudaBoliviaBosnia and HerzegovinaBrazilBrunei DarussalamBulgariaBurkina FasoBurundiCabo VerdeCambodiaCameroonCanadaCaribbean small statesCentral African RepublicCentral Europe and the BalticsChadChileChinaColombiaComorosCongo, Dem. Rep.Congo, Rep.Costa RicaCote d'IvoireCroatiaCubaCyprusCzech RepublicDenmarkDjiboutiDominicaDominican RepublicEarly-demographic dividendEast Asia & PacificEast Asia & Pacific (excluding high income)East Asia & Pacific (IDA & IBRD countries)EcuadorEgypt, Arab Rep.El SalvadorEquatorial GuineaEstoniaEthiopiaEuro areaEurope & Central AsiaEurope & Central Asia (excluding high income)Europe & Central Asia (IDA & IBRD countries)European UnionFaroe IslandsFijiFinlandFragile and conflict affected situationsFranceFrench PolynesiaGabonGambia, TheGeorgiaGermanyGhanaGibraltarGreeceGreenlandGrenadaGuamGuatemalaGuineaGuinea-BissauGuyanaHaitiHeavily indebted poor countries (HIPC)High incomeHondurasHong Kong SAR, ChinaHungaryIBRD onlyIcelandIDA & IBRD totalIDA blendIDA onlyIDA totalIndiaIndonesiaIran, Islamic Rep.IraqIrelandIsraelItalyJamaicaJapanJordanKazakhstanKenyaKiribatiKorea, Dem. People’s Rep.Korea, Rep.KosovoKuwaitKyrgyz RepublicLao PDRLate-demographic dividendLatin America & Caribbean Latin America & Caribbean (excluding high income)Latin America & the Caribbean (IDA & IBRD countries)LatviaLeast developed countries: UN classificationLebanonLiberiaLibyaLithuaniaLow & middle incomeLow incomeLower middle incomeLuxembourgMacao SAR, ChinaMacedonia, FYRMadagascarMalawiMalaysiaMaldivesMaliMaltaMauritaniaMauritiusMexicoMiddle East & North AfricaMiddle East & North Africa (excluding high income)Middle East & North Africa (IDA & IBRD countries)Middle incomeMoldovaMongoliaMontenegroMoroccoMozambiqueMyanmarNauruNepalNetherlandsNew CaledoniaNew ZealandNicaraguaNigerNigeriaNorth AmericaNorwayOECD membersOmanOther small statesPacific island small statesPakistanPanamaPapua New GuineaParaguayPeruPhilippinesPolandPortugalPost-demographic dividendPre-demographic dividendQatarRomaniaRussian FederationRwandaSamoaSao Tome and PrincipeSaudi ArabiaSenegalSerbiaSeychellesSierra LeoneSingaporeSlovak RepublicSloveniaSmall statesSolomon IslandsSomaliaSouth AfricaSouth AsiaSouth Asia (IDA & IBRD)SpainSri LankaSt. Kitts and NevisSt. LuciaSt. Vincent and the GrenadinesSub-Saharan Africa Sub-Saharan Africa (excluding high income)Sub-Saharan Africa (IDA & IBRD countries)SudanSurinameSwedenSwitzerlandSyrian Arab RepublicTajikistanTanzaniaThailandTogoTongaTrinidad and TobagoTunisiaTurkeyTurkmenistanTuvaluUgandaUkraineUnited Arab EmiratesUnited KingdomUnited StatesUpper middle incomeUruguayUzbekistanVanuatuVenezuela, RBVietnamWorldYemen, Rep.ZambiaZimbabwe Linha do tempo:
Nesta escala de tempo está apresentado um gráfico de 1961 ano até 2015 ano Turkey. Dados de 1960 ano ausente. O número de observações reais por data: 55.
Fonte (nome):
Indicadores de desenvolvimento mundial
Fonte (organização):
World Bank staff estimates based data from International Monetary Fund's Direction of Trade database.
Categorias:
Private Sector, Trade
Foi atualizado:
23 abr 2017 ano
Indicadores de alterações dos valores ao longo dos anos
Mínimo:
0.711
1 jan 2009 ano
Máximo:
14.76
1 jan 1974 ano
Na data de observação
Valor
Mudança absoluta
A alteração em relação ao valor anterior
1 jan 1961 ano
9.408
+9.408
0.0%
1 jan 1962 ano
8.314
-1.094
-11.63%
1 jan 1963 ano
7.46
-0.854
-10.27%
1 jan 1964 ano
9.911
+2.451
32.86%
1 jan 1965 ano
12.255
+2.344
23.65%
1 jan 1966 ano
9.434
-2.822
-23.02%
1 jan 1967 ano
10.645
+1.211
12.84%
1 jan 1968 ano
12.265
+1.62
15.22%
1 jan 1969 ano
11.864
-0.401
-3.27%
1 jan 1970 ano
11.64
-0.224
-1.89%
1 jan 1971 ano
10.931
-0.709
-6.09%
1 jan 1972 ano
13.406
+2.475
22.64%
1 jan 1973 ano
13.137
-0.269
-2.0%
1 jan 1974 ano
14.76
+1.623
12.35%
1 jan 1975 ano
9.306
-5.455
-36.96%
1 jan 1976 ano
7.492
-1.814
-19.49%
1 jan 1977 ano
8.008
+0.516
6.89%
1 jan 1978 ano
9.0
+0.992
12.38%
1 jan 1979 ano
10.531
+1.531
17.02%
1 jan 1980 ano
13.124
+2.593
24.62%
1 jan 1981 ano
13.475
+0.351
2.68%
1 jan 1982 ano
10.537
-2.938
-21.8%
1 jan 1983 ano
5.839
-4.698
-44.58%
1 jan 1984 ano
8.853
+3.014
51.61%
1 jan 1985 ano
9.434
+0.581
6.57%
1 jan 1986 ano
7.136
-2.298
-24.36%
1 jan 1987 ano
9.181
+2.044
28.65%
1 jan 1988 ano
12.885
+3.705
40.35%
1 jan 1989 ano
12.999
+0.113
0.88%
1 jan 1990 ano
12.102
-0.897
-6.9%
1 jan 1991 ano
12.747
+0.645
5.33%
1 jan 1992 ano
11.285
-1.462
-11.47%
1 jan 1993 ano
13.687
+2.402
21.29%
1 jan 1994 ano
14.693
+1.005
7.35%
1 jan 1995 ano
4.245
-10.448
-71.11%
1 jan 1996 ano
2.701
-1.543
-36.36%
1 jan 1997 ano
3.769
+1.067
39.51%
1 jan 1998 ano
2.206
-1.563
-41.47%
1 jan 1999 ano
1.638
-0.568
-25.76%
1 jan 2000 ano
3.779
+2.141
130.76%
1 jan 2001 ano
3.227
-0.552
-14.6%
1 jan 2002 ano
2.572
-0.655
-20.29%
1 jan 2003 ano
3.165
+0.593
23.04%
1 jan 2004 ano
1.905
-1.26
-39.82%
1 jan 2005 ano
1.027
-0.878
-46.08%
1 jan 2006 ano
0.896
-0.131
-12.77%
1 jan 2007 ano
0.807
-0.089
-9.9%
1 jan 2008 ano
0.843
+0.035
4.39%
1 jan 2009 ano
0.711
-0.131
-15.6%
1 jan 2010 ano
0.824
+0.112
15.82%
1 jan 2011 ano
0.993
+0.17
20.62%
1 jan 2012 ano
4.119
+3.126
314.68%
1 jan 2013 ano
5.807
+1.688
40.98%
1 jan 2014 ano
5.871
+0.064
1.1%
1 jan 2015 ano
6.198
+0.327
5.57%
Classificação de países por estatísticas atuais por anos


Comentários: