29
/pt/
pt
AIzaSyAYiBZKx7MnpbEhh9jyipgxe19OcubqV5w
April 1, 2024
156284
Indonesia
IDN
true
2
1
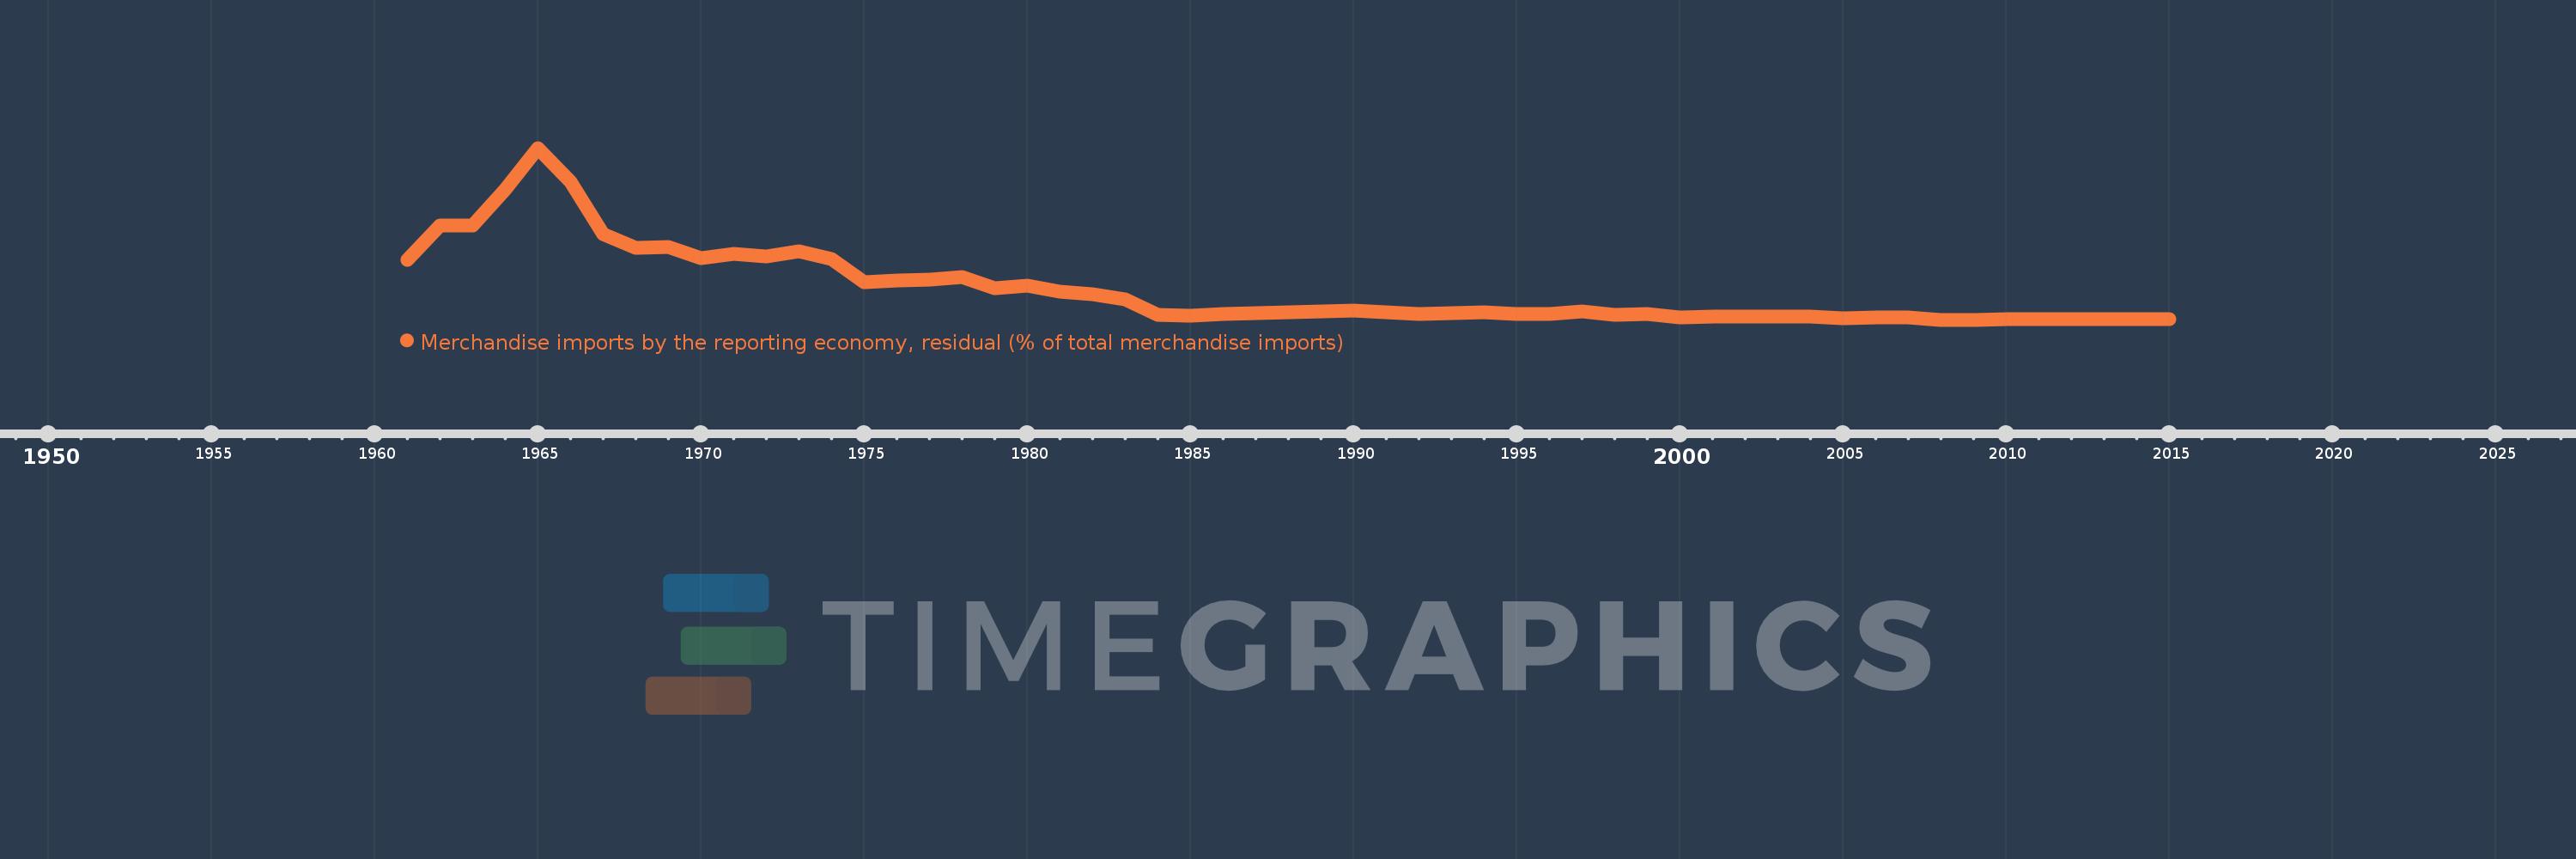
Merchandise imports by the reporting economy, residual (% of total merchandise imports)
2015,2014,2013,2012,2011,2010,2009,2008,2007,2006,2005,2004,2003,2002,2001,2000,1999,1998,1997,1996,1995,1994,1993,1992,1991,1990,1989,1988,1987,1986,1985,1984,1983,1982,1981,1980,1979,1978,1977,1976,1975,1974,1973,1972,1971,1970,1969,1968,1967,1966,1965,1964,1963,1962,1961
Estas estatísticas em outros países:
AfghanistanAlbaniaAlgeriaAmerican SamoaAngolaAntigua and BarbudaArab WorldArgentinaArmeniaArubaAustraliaAustriaAzerbaijanBahamas, TheBahrainBangladeshBarbadosBelarusBelgiumBelizeBeninBermudaBoliviaBosnia and HerzegovinaBrazilBrunei DarussalamBulgariaBurkina FasoBurundiCabo VerdeCambodiaCameroonCanadaCaribbean small statesCentral African RepublicCentral Europe and the BalticsChadChileChinaColombiaComorosCongo, Dem. Rep.Congo, Rep.Costa RicaCote d'IvoireCroatiaCubaCyprusCzech RepublicDenmarkDjiboutiDominicaDominican RepublicEarly-demographic dividendEast Asia & PacificEast Asia & Pacific (excluding high income)East Asia & Pacific (IDA & IBRD countries)EcuadorEgypt, Arab Rep.El SalvadorEquatorial GuineaEstoniaEthiopiaEuro areaEurope & Central AsiaEurope & Central Asia (excluding high income)Europe & Central Asia (IDA & IBRD countries)European UnionFaroe IslandsFijiFinlandFragile and conflict affected situationsFranceFrench PolynesiaGabonGambia, TheGeorgiaGermanyGhanaGibraltarGreeceGreenlandGrenadaGuamGuatemalaGuineaGuinea-BissauGuyanaHaitiHeavily indebted poor countries (HIPC)High incomeHondurasHong Kong SAR, ChinaHungaryIBRD onlyIcelandIDA & IBRD totalIDA blendIDA onlyIDA totalIndiaIndonesiaIran, Islamic Rep.IraqIrelandIsraelItalyJamaicaJapanJordanKazakhstanKenyaKiribatiKorea, Dem. People’s Rep.Korea, Rep.KosovoKuwaitKyrgyz RepublicLao PDRLate-demographic dividendLatin America & Caribbean Latin America & Caribbean (excluding high income)Latin America & the Caribbean (IDA & IBRD countries)LatviaLeast developed countries: UN classificationLebanonLiberiaLibyaLithuaniaLow & middle incomeLow incomeLower middle incomeLuxembourgMacao SAR, ChinaMacedonia, FYRMadagascarMalawiMalaysiaMaldivesMaliMaltaMauritaniaMauritiusMexicoMiddle East & North AfricaMiddle East & North Africa (excluding high income)Middle East & North Africa (IDA & IBRD countries)Middle incomeMoldovaMongoliaMontenegroMoroccoMozambiqueMyanmarNauruNepalNetherlandsNew CaledoniaNew ZealandNicaraguaNigerNigeriaNorth AmericaNorwayOECD membersOmanOther small statesPacific island small statesPakistanPanamaPapua New GuineaParaguayPeruPhilippinesPolandPortugalPost-demographic dividendPre-demographic dividendQatarRomaniaRussian FederationRwandaSamoaSao Tome and PrincipeSaudi ArabiaSenegalSerbiaSeychellesSierra LeoneSingaporeSlovak RepublicSloveniaSmall statesSolomon IslandsSomaliaSouth AfricaSouth AsiaSouth Asia (IDA & IBRD)SpainSri LankaSt. Kitts and NevisSt. LuciaSt. Vincent and the GrenadinesSub-Saharan Africa Sub-Saharan Africa (excluding high income)Sub-Saharan Africa (IDA & IBRD countries)SudanSurinameSwedenSwitzerlandSyrian Arab RepublicTajikistanTanzaniaThailandTogoTongaTrinidad and TobagoTunisiaTurkeyTurkmenistanTuvaluUgandaUkraineUnited Arab EmiratesUnited KingdomUnited StatesUpper middle incomeUruguayUzbekistanVanuatuVenezuela, RBVietnamWorldYemen, Rep.ZambiaZimbabwe Linha do tempo:
Nesta escala de tempo está apresentado um gráfico de 1961 ano até 2015 ano Indonesia. Dados de 1960 ano ausente. O número de observações reais por data: 55.
Fonte (nome):
Indicadores de desenvolvimento mundial
Fonte (organização):
World Bank staff estimates based data from International Monetary Fund's Direction of Trade database.
Categorias:
Private Sector, Trade
Foi atualizado:
23 abr 2017 ano
Indicadores de alterações dos valores ao longo dos anos
Mínimo:
0.037
1 jan 2008 ano
Máximo:
46.396
1 jan 1965 ano
Na data de observação
Valor
Mudança absoluta
A alteração em relação ao valor anterior
1 jan 1961 ano
16.181
+16.181
0.0%
1 jan 1962 ano
25.567
+9.386
58.01%
1 jan 1963 ano
25.443
-0.125
-0.49%
1 jan 1964 ano
35.106
+9.663
37.98%
1 jan 1965 ano
46.396
+11.291
32.16%
1 jan 1966 ano
37.193
-9.204
-19.84%
1 jan 1967 ano
23.103
-14.09
-37.88%
1 jan 1968 ano
19.357
-3.746
-16.21%
1 jan 1969 ano
19.596
+0.239
1.24%
1 jan 1970 ano
16.721
-2.875
-14.67%
1 jan 1971 ano
17.855
+1.134
6.78%
1 jan 1972 ano
17.176
-0.679
-3.8%
1 jan 1973 ano
18.582
+1.406
8.18%
1 jan 1974 ano
16.466
-2.116
-11.39%
1 jan 1975 ano
10.147
-6.319
-38.38%
1 jan 1976 ano
10.676
+0.53
5.22%
1 jan 1977 ano
10.801
+0.124
1.16%
1 jan 1978 ano
11.455
+0.655
6.06%
1 jan 1979 ano
8.445
-3.01
-26.28%
1 jan 1980 ano
9.293
+0.848
10.04%
1 jan 1981 ano
7.575
-1.719
-18.49%
1 jan 1982 ano
7.013
-0.562
-7.42%
1 jan 1983 ano
5.545
-1.468
-20.94%
1 jan 1984 ano
1.267
-4.278
-77.16%
1 jan 1985 ano
1.236
-0.03
-2.39%
1 jan 1986 ano
1.53
+0.294
23.75%
1 jan 1987 ano
1.766
+0.236
15.43%
1 jan 1988 ano
2.114
+0.348
19.72%
1 jan 1989 ano
2.374
+0.26
12.27%
1 jan 1990 ano
2.579
+0.206
8.66%
1 jan 1991 ano
2.035
-0.544
-21.1%
1 jan 1992 ano
1.695
-0.341
-16.74%
1 jan 1993 ano
1.859
+0.165
9.71%
1 jan 1994 ano
2.05
+0.19
10.24%
1 jan 1995 ano
1.677
-0.373
-18.19%
1 jan 1996 ano
1.702
+0.026
1.53%
1 jan 1997 ano
2.371
+0.669
39.29%
1 jan 1998 ano
1.361
-1.01
-42.59%
1 jan 1999 ano
1.516
+0.155
11.38%
1 jan 2000 ano
0.683
-0.834
-54.98%
1 jan 2001 ano
0.962
+0.279
40.88%
1 jan 2002 ano
0.935
-0.027
-2.77%
1 jan 2003 ano
0.812
-0.123
-13.19%
1 jan 2004 ano
0.986
+0.174
21.48%
1 jan 2005 ano
0.527
-0.459
-46.53%
1 jan 2006 ano
0.556
+0.029
5.43%
1 jan 2007 ano
0.709
+0.153
27.56%
1 jan 2008 ano
0.037
-0.672
-94.71%
1 jan 2009 ano
0.064
+0.026
70.49%
1 jan 2010 ano
0.177
+0.113
177.27%
1 jan 2011 ano
0.13
-0.047
-26.56%
1 jan 2012 ano
0.134
+0.004
2.99%
1 jan 2013 ano
0.117
-0.017
-13.01%
1 jan 2014 ano
0.114
-0.002
-2.02%
1 jan 2015 ano
0.125
+0.01
9.17%
Classificação de países por estatísticas atuais por anos


Comentários: