29
/pt/
pt
AIzaSyAYiBZKx7MnpbEhh9jyipgxe19OcubqV5w
April 1, 2024
153792
Iceland
ISL
true
2
1
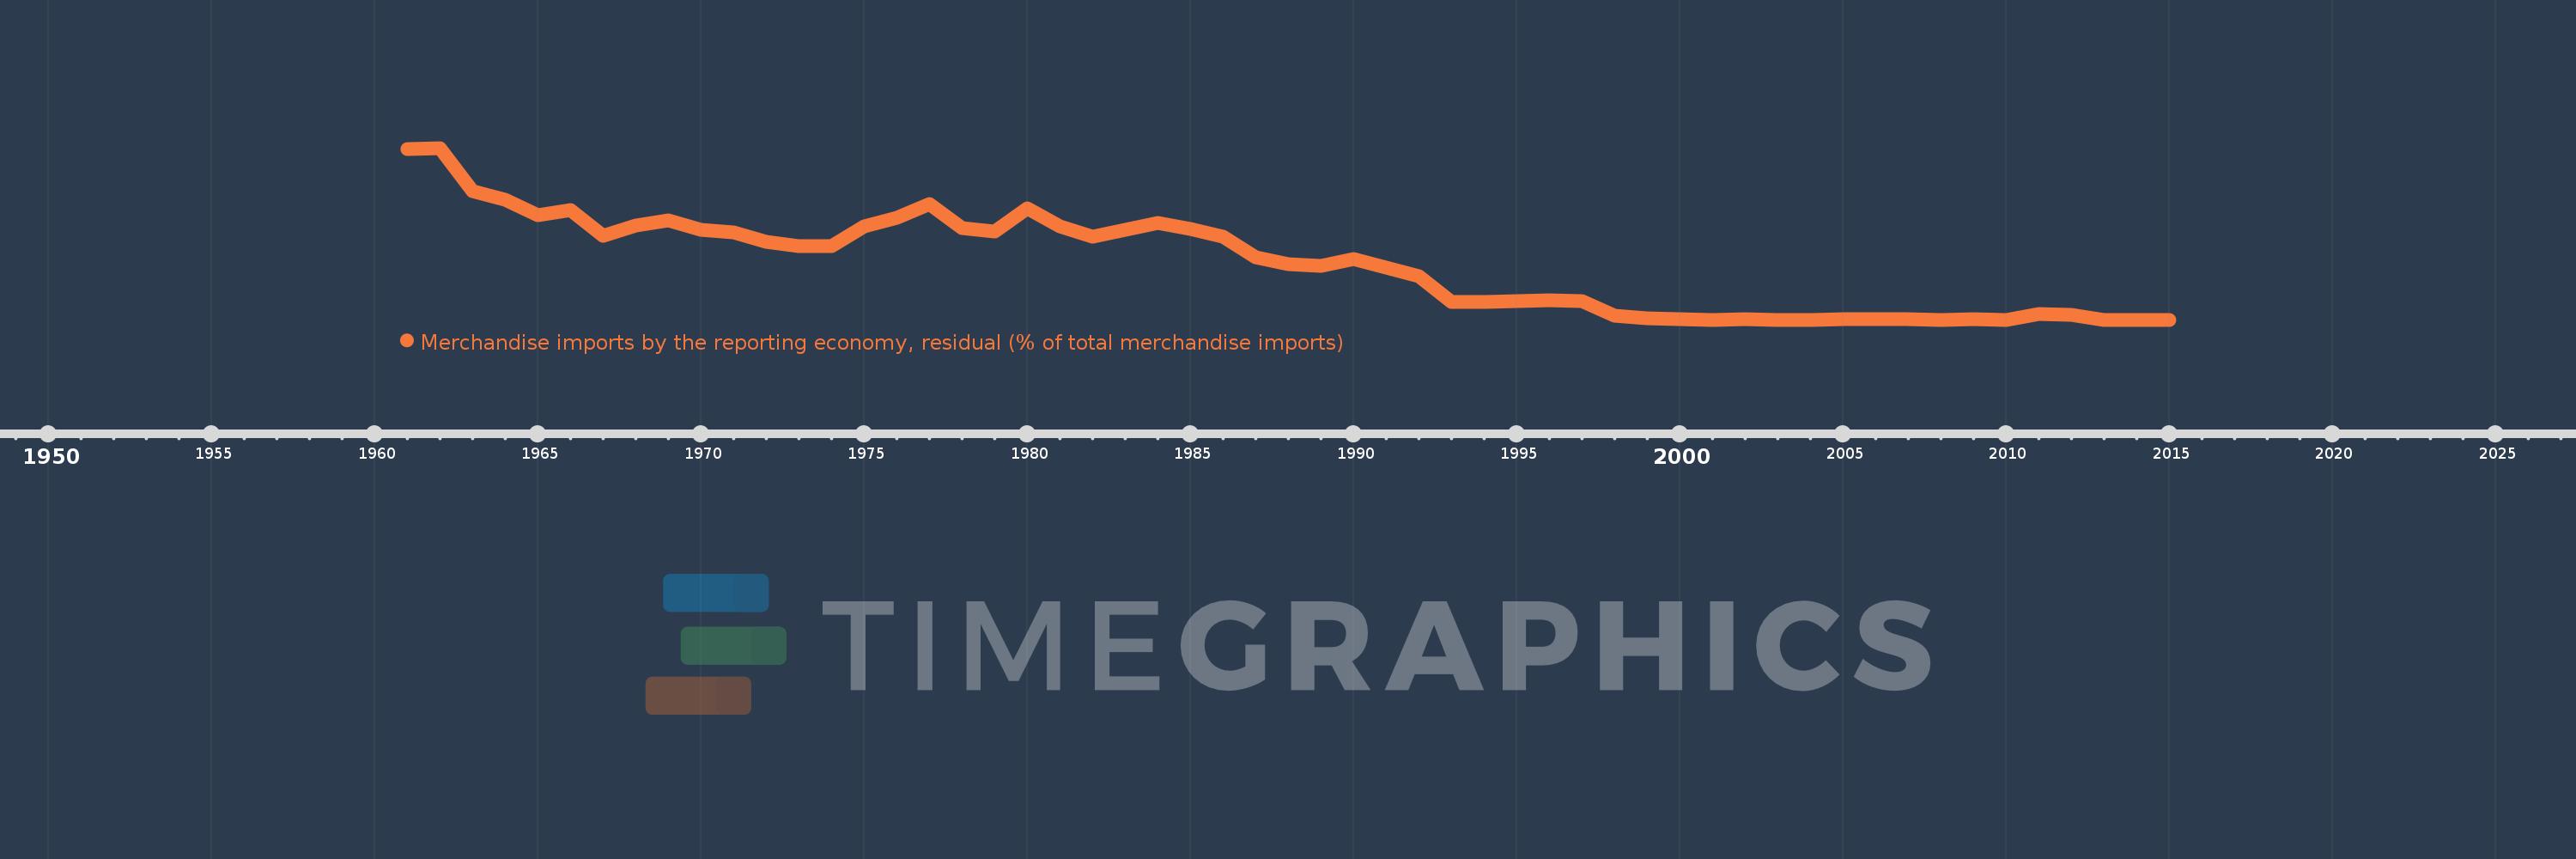
Merchandise imports by the reporting economy, residual (% of total merchandise imports)
2015,2014,2013,2012,2011,2010,2009,2008,2007,2006,2005,2004,2003,2002,2001,2000,1999,1998,1997,1996,1995,1994,1993,1992,1991,1990,1989,1988,1987,1986,1985,1984,1983,1982,1981,1980,1979,1978,1977,1976,1975,1974,1973,1972,1971,1970,1969,1968,1967,1966,1965,1964,1963,1962,1961
Estas estatísticas em outros países:
AfghanistanAlbaniaAlgeriaAmerican SamoaAngolaAntigua and BarbudaArab WorldArgentinaArmeniaArubaAustraliaAustriaAzerbaijanBahamas, TheBahrainBangladeshBarbadosBelarusBelgiumBelizeBeninBermudaBoliviaBosnia and HerzegovinaBrazilBrunei DarussalamBulgariaBurkina FasoBurundiCabo VerdeCambodiaCameroonCanadaCaribbean small statesCentral African RepublicCentral Europe and the BalticsChadChileChinaColombiaComorosCongo, Dem. Rep.Congo, Rep.Costa RicaCote d'IvoireCroatiaCubaCyprusCzech RepublicDenmarkDjiboutiDominicaDominican RepublicEarly-demographic dividendEast Asia & PacificEast Asia & Pacific (excluding high income)East Asia & Pacific (IDA & IBRD countries)EcuadorEgypt, Arab Rep.El SalvadorEquatorial GuineaEstoniaEthiopiaEuro areaEurope & Central AsiaEurope & Central Asia (excluding high income)Europe & Central Asia (IDA & IBRD countries)European UnionFaroe IslandsFijiFinlandFragile and conflict affected situationsFranceFrench PolynesiaGabonGambia, TheGeorgiaGermanyGhanaGibraltarGreeceGreenlandGrenadaGuamGuatemalaGuineaGuinea-BissauGuyanaHaitiHeavily indebted poor countries (HIPC)High incomeHondurasHong Kong SAR, ChinaHungaryIBRD onlyIcelandIDA & IBRD totalIDA blendIDA onlyIDA totalIndiaIndonesiaIran, Islamic Rep.IraqIrelandIsraelItalyJamaicaJapanJordanKazakhstanKenyaKiribatiKorea, Dem. People’s Rep.Korea, Rep.KosovoKuwaitKyrgyz RepublicLao PDRLate-demographic dividendLatin America & Caribbean Latin America & Caribbean (excluding high income)Latin America & the Caribbean (IDA & IBRD countries)LatviaLeast developed countries: UN classificationLebanonLiberiaLibyaLithuaniaLow & middle incomeLow incomeLower middle incomeLuxembourgMacao SAR, ChinaMacedonia, FYRMadagascarMalawiMalaysiaMaldivesMaliMaltaMauritaniaMauritiusMexicoMiddle East & North AfricaMiddle East & North Africa (excluding high income)Middle East & North Africa (IDA & IBRD countries)Middle incomeMoldovaMongoliaMontenegroMoroccoMozambiqueMyanmarNauruNepalNetherlandsNew CaledoniaNew ZealandNicaraguaNigerNigeriaNorth AmericaNorwayOECD membersOmanOther small statesPacific island small statesPakistanPanamaPapua New GuineaParaguayPeruPhilippinesPolandPortugalPost-demographic dividendPre-demographic dividendQatarRomaniaRussian FederationRwandaSamoaSao Tome and PrincipeSaudi ArabiaSenegalSerbiaSeychellesSierra LeoneSingaporeSlovak RepublicSloveniaSmall statesSolomon IslandsSomaliaSouth AfricaSouth AsiaSouth Asia (IDA & IBRD)SpainSri LankaSt. Kitts and NevisSt. LuciaSt. Vincent and the GrenadinesSub-Saharan Africa Sub-Saharan Africa (excluding high income)Sub-Saharan Africa (IDA & IBRD countries)SudanSurinameSwedenSwitzerlandSyrian Arab RepublicTajikistanTanzaniaThailandTogoTongaTrinidad and TobagoTunisiaTurkeyTurkmenistanTuvaluUgandaUkraineUnited Arab EmiratesUnited KingdomUnited StatesUpper middle incomeUruguayUzbekistanVanuatuVenezuela, RBVietnamWorldYemen, Rep.ZambiaZimbabwe Linha do tempo:
Nesta escala de tempo está apresentado um gráfico de 1961 ano até 2015 ano Iceland. Dados de 1960 ano ausente. O número de observações reais por data: 55.
Fonte (nome):
Indicadores de desenvolvimento mundial
Fonte (organização):
World Bank staff estimates based data from International Monetary Fund's Direction of Trade database.
Categorias:
Private Sector, Trade
Foi atualizado:
23 abr 2017 ano
Indicadores de alterações dos valores ao longo dos anos
Máximo:
23.72
1 jan 1962 ano
Na data de observação
Valor
Mudança absoluta
A alteração em relação ao valor anterior
1 jan 1961 ano
23.576
+23.576
0.0%
1 jan 1962 ano
23.72
+0.143
0.61%
1 jan 1963 ano
17.753
-5.967
-25.16%
1 jan 1964 ano
16.59
-1.163
-6.55%
1 jan 1965 ano
14.384
-2.206
-13.3%
1 jan 1966 ano
15.149
+0.765
5.32%
1 jan 1967 ano
11.558
-3.592
-23.71%
1 jan 1968 ano
13.065
+1.507
13.04%
1 jan 1969 ano
13.703
+0.638
4.88%
1 jan 1970 ano
12.461
-1.242
-9.06%
1 jan 1971 ano
12.047
-0.414
-3.32%
1 jan 1972 ano
10.738
-1.309
-10.86%
1 jan 1973 ano
10.122
-0.616
-5.74%
1 jan 1974 ano
10.162
+0.04
0.39%
1 jan 1975 ano
12.916
+2.754
27.1%
1 jan 1976 ano
14.076
+1.16
8.98%
1 jan 1977 ano
15.971
+1.895
13.46%
1 jan 1978 ano
12.665
-3.305
-20.7%
1 jan 1979 ano
12.158
-0.508
-4.01%
1 jan 1980 ano
15.428
+3.27
26.89%
1 jan 1981 ano
12.889
-2.539
-16.46%
1 jan 1982 ano
11.522
-1.367
-10.61%
1 jan 1983 ano
12.39
+0.868
7.53%
1 jan 1984 ano
13.338
+0.949
7.66%
1 jan 1985 ano
12.551
-0.787
-5.9%
1 jan 1986 ano
11.473
-1.078
-8.59%
1 jan 1987 ano
8.675
-2.799
-24.39%
1 jan 1988 ano
7.639
-1.036
-11.94%
1 jan 1989 ano
7.459
-0.18
-2.35%
1 jan 1990 ano
8.367
+0.908
12.17%
1 jan 1991 ano
7.2
-1.167
-13.95%
1 jan 1992 ano
6.047
-1.153
-16.01%
1 jan 1993 ano
2.469
-3.578
-59.17%
1 jan 1994 ano
2.426
-0.043
-1.75%
1 jan 1995 ano
2.626
+0.2
8.24%
1 jan 1996 ano
2.698
+0.072
2.74%
1 jan 1997 ano
2.523
-0.174
-6.46%
1 jan 1998 ano
0.599
-1.924
-76.25%
1 jan 1999 ano
0.159
-0.44
-73.4%
1 jan 2000 ano
0.071
-0.089
-55.74%
1 jan 2001 ano
0.018
-0.052
-74.17%
1 jan 2002 ano
0.042
+0.024
129.61%
1 jan 2003 ano
0.022
-0.02
-47.61%
1 jan 2004 ano
0.007
-0.015
-70.28%
1 jan 2005 ano
0.063
+0.057
872.36%
1 jan 2006 ano
0.029
-0.035
-54.77%
1 jan 2007 ano
0.127
+0.098
341.97%
1 jan 2008 ano
0.009
-0.118
-93.28%
1 jan 2009 ano
0.073
+0.065
761.35%
1 jan 2010 ano
0.002
-0.071
-97.06%
1 jan 2011 ano
0.802
+0.8
37.1 mil%
1 jan 2012 ano
0.701
-0.101
-12.54%
1 jan 2013 ano
0.0
-0.701
-100.0%
1 jan 2014 ano
0.0
+0.0
-4.94 milhões%
1 jan 2015 ano
0.0
0.0
-98.82%
Classificação de países por estatísticas atuais por anos


Comentários: