29
/pt/
pt
AIzaSyAYiBZKx7MnpbEhh9jyipgxe19OcubqV5w
April 1, 2024
157571
Iran, Islamic Rep.
IRN
true
2
1
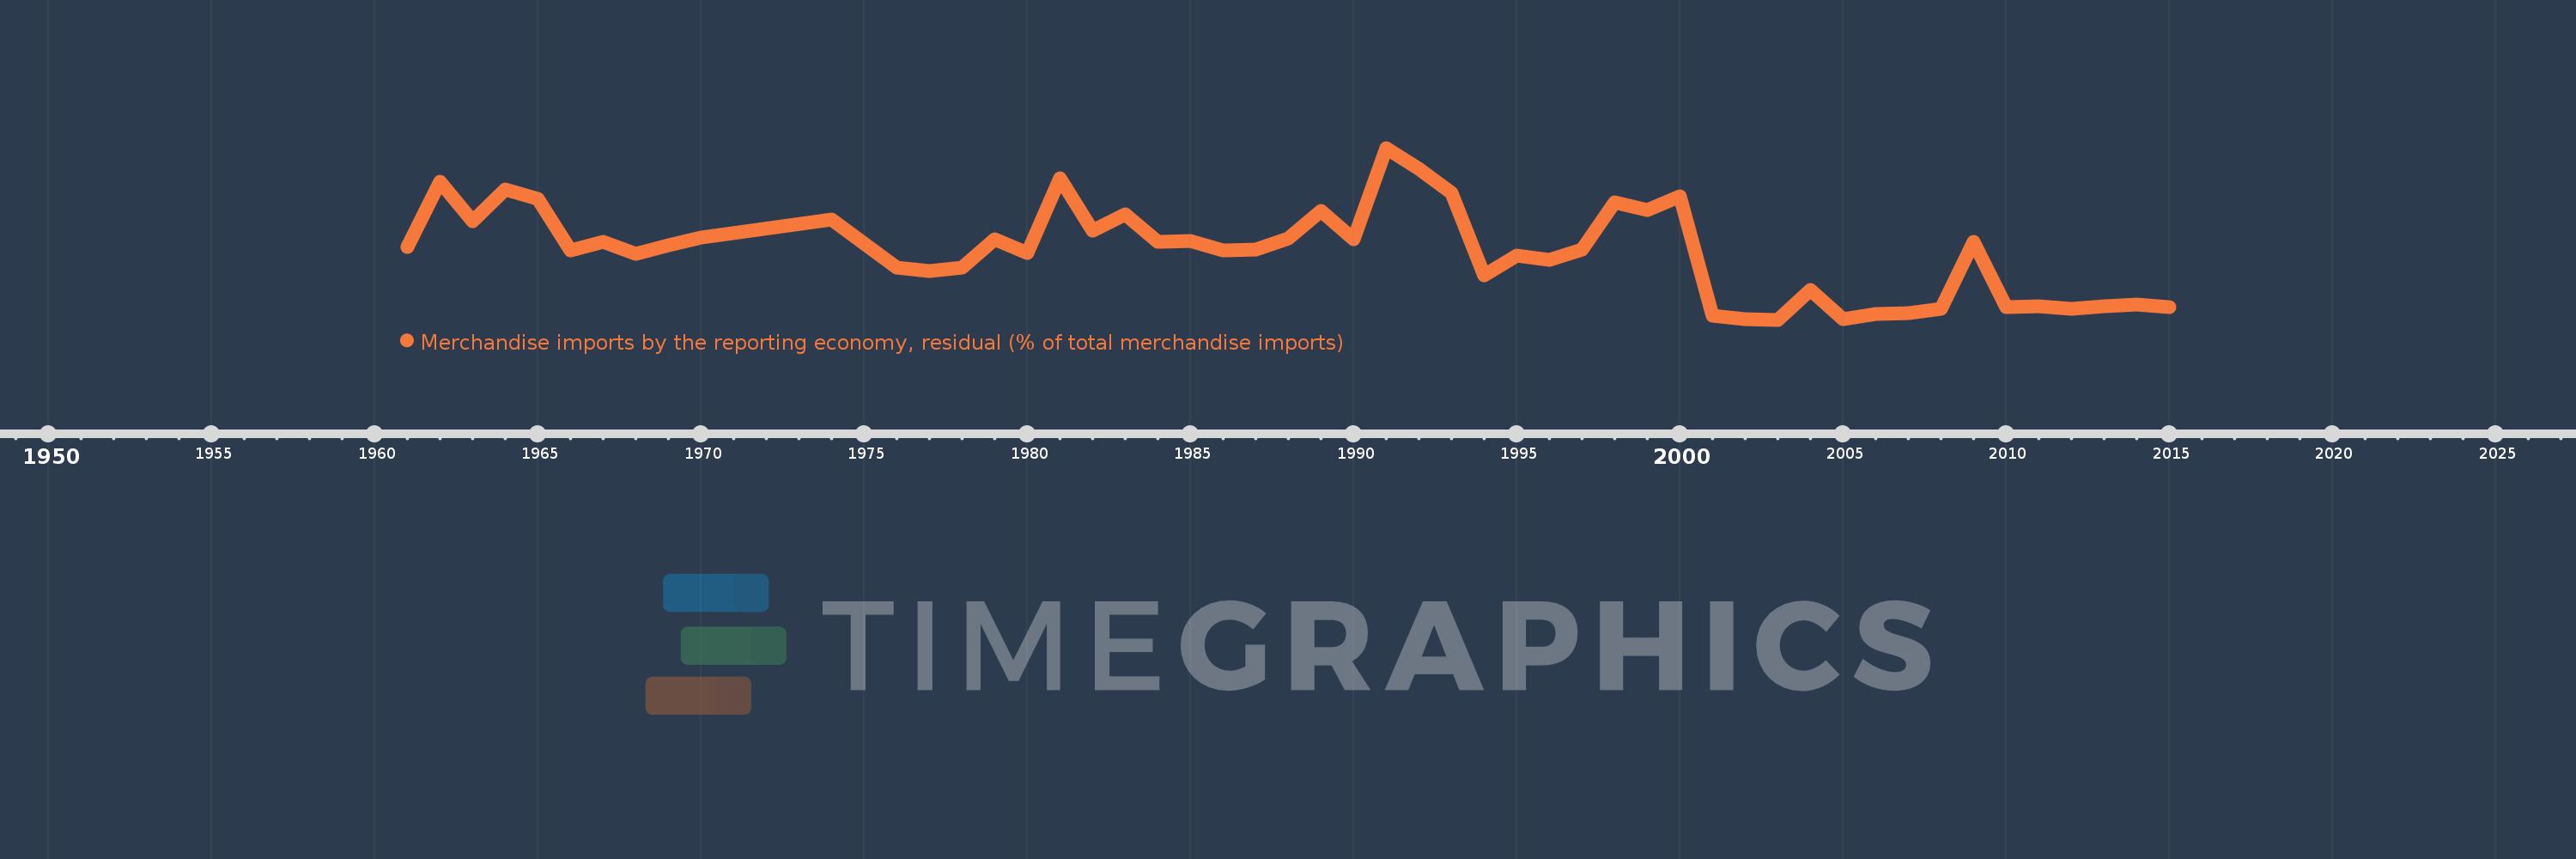
Merchandise imports by the reporting economy, residual (% of total merchandise imports)
2015,2014,2013,2012,2011,2010,2009,2008,2007,2006,2005,2004,2003,2002,2001,2000,1999,1998,1997,1996,1995,1994,1993,1992,1991,1990,1989,1988,1987,1986,1985,1984,1983,1982,1981,1980,1979,1978,1977,1976,1975,1974,1970,1969,1968,1967,1966,1965,1964,1963,1962,1961
Estas estatísticas em outros países:
AfghanistanAlbaniaAlgeriaAmerican SamoaAngolaAntigua and BarbudaArab WorldArgentinaArmeniaArubaAustraliaAustriaAzerbaijanBahamas, TheBahrainBangladeshBarbadosBelarusBelgiumBelizeBeninBermudaBoliviaBosnia and HerzegovinaBrazilBrunei DarussalamBulgariaBurkina FasoBurundiCabo VerdeCambodiaCameroonCanadaCaribbean small statesCentral African RepublicCentral Europe and the BalticsChadChileChinaColombiaComorosCongo, Dem. Rep.Congo, Rep.Costa RicaCote d'IvoireCroatiaCubaCyprusCzech RepublicDenmarkDjiboutiDominicaDominican RepublicEarly-demographic dividendEast Asia & PacificEast Asia & Pacific (excluding high income)East Asia & Pacific (IDA & IBRD countries)EcuadorEgypt, Arab Rep.El SalvadorEquatorial GuineaEstoniaEthiopiaEuro areaEurope & Central AsiaEurope & Central Asia (excluding high income)Europe & Central Asia (IDA & IBRD countries)European UnionFaroe IslandsFijiFinlandFragile and conflict affected situationsFranceFrench PolynesiaGabonGambia, TheGeorgiaGermanyGhanaGibraltarGreeceGreenlandGrenadaGuamGuatemalaGuineaGuinea-BissauGuyanaHaitiHeavily indebted poor countries (HIPC)High incomeHondurasHong Kong SAR, ChinaHungaryIBRD onlyIcelandIDA & IBRD totalIDA blendIDA onlyIDA totalIndiaIndonesiaIran, Islamic Rep.IraqIrelandIsraelItalyJamaicaJapanJordanKazakhstanKenyaKiribatiKorea, Dem. People’s Rep.Korea, Rep.KosovoKuwaitKyrgyz RepublicLao PDRLate-demographic dividendLatin America & Caribbean Latin America & Caribbean (excluding high income)Latin America & the Caribbean (IDA & IBRD countries)LatviaLeast developed countries: UN classificationLebanonLiberiaLibyaLithuaniaLow & middle incomeLow incomeLower middle incomeLuxembourgMacao SAR, ChinaMacedonia, FYRMadagascarMalawiMalaysiaMaldivesMaliMaltaMauritaniaMauritiusMexicoMiddle East & North AfricaMiddle East & North Africa (excluding high income)Middle East & North Africa (IDA & IBRD countries)Middle incomeMoldovaMongoliaMontenegroMoroccoMozambiqueMyanmarNauruNepalNetherlandsNew CaledoniaNew ZealandNicaraguaNigerNigeriaNorth AmericaNorwayOECD membersOmanOther small statesPacific island small statesPakistanPanamaPapua New GuineaParaguayPeruPhilippinesPolandPortugalPost-demographic dividendPre-demographic dividendQatarRomaniaRussian FederationRwandaSamoaSao Tome and PrincipeSaudi ArabiaSenegalSerbiaSeychellesSierra LeoneSingaporeSlovak RepublicSloveniaSmall statesSolomon IslandsSomaliaSouth AfricaSouth AsiaSouth Asia (IDA & IBRD)SpainSri LankaSt. Kitts and NevisSt. LuciaSt. Vincent and the GrenadinesSub-Saharan Africa Sub-Saharan Africa (excluding high income)Sub-Saharan Africa (IDA & IBRD countries)SudanSurinameSwedenSwitzerlandSyrian Arab RepublicTajikistanTanzaniaThailandTogoTongaTrinidad and TobagoTunisiaTurkeyTurkmenistanTuvaluUgandaUkraineUnited Arab EmiratesUnited KingdomUnited StatesUpper middle incomeUruguayUzbekistanVanuatuVenezuela, RBVietnamWorldYemen, Rep.ZambiaZimbabwe Linha do tempo:
Nesta escala de tempo está apresentado um gráfico de 1961 ano até 2015 ano Iran, Islamic Rep.. Dados de 1960 ano ausente. O número de observações reais por data: 52.
Fonte (nome):
Indicadores de desenvolvimento mundial
Fonte (organização):
World Bank staff estimates based data from International Monetary Fund's Direction of Trade database.
Categorias:
Private Sector, Trade
Foi atualizado:
23 abr 2017 ano
Indicadores de alterações dos valores ao longo dos anos
Mínimo:
0.283
1 jan 2003 ano
Máximo:
16.708
1 jan 1991 ano
Na data de observação
Valor
Mudança absoluta
A alteração em relação ao valor anterior
1 jan 1961 ano
7.201
+7.201
0.0%
1 jan 1962 ano
13.466
+6.266
87.02%
1 jan 1963 ano
9.662
-3.804
-28.25%
1 jan 1964 ano
12.769
+3.107
32.16%
1 jan 1965 ano
11.87
-0.899
-7.04%
1 jan 1966 ano
6.945
-4.925
-41.49%
1 jan 1967 ano
7.691
+0.746
10.74%
1 jan 1968 ano
6.566
-1.124
-14.62%
1 jan 1969 ano
7.437
+0.871
13.26%
1 jan 1970 ano
8.148
+0.711
9.56%
1 jan 1974 ano
9.896
+1.748
21.46%
1 jan 1975 ano
7.579
-2.318
-23.42%
1 jan 1976 ano
5.255
-2.323
-30.66%
1 jan 1977 ano
4.959
-0.296
-5.63%
1 jan 1978 ano
5.233
+0.274
5.52%
1 jan 1979 ano
7.954
+2.721
52.0%
1 jan 1980 ano
6.653
-1.301
-16.36%
1 jan 1981 ano
13.845
+7.192
108.1%
1 jan 1982 ano
8.805
-5.04
-36.4%
1 jan 1983 ano
10.367
+1.562
17.74%
1 jan 1984 ano
7.745
-2.623
-25.3%
1 jan 1985 ano
7.845
+0.1
1.29%
1 jan 1986 ano
6.916
-0.928
-11.84%
1 jan 1987 ano
7.023
+0.107
1.54%
1 jan 1988 ano
8.037
+1.014
14.44%
1 jan 1989 ano
10.709
+2.671
33.24%
1 jan 1990 ano
8.003
-2.705
-25.26%
1 jan 1991 ano
16.708
+8.705
108.76%
1 jan 1992 ano
14.688
-2.02
-12.09%
1 jan 1993 ano
12.381
-2.307
-15.71%
1 jan 1994 ano
4.548
-7.834
-63.27%
1 jan 1995 ano
6.419
+1.871
41.15%
1 jan 1996 ano
6.004
-0.415
-6.46%
1 jan 1997 ano
7.011
+1.007
16.77%
1 jan 1998 ano
11.545
+4.533
64.66%
1 jan 1999 ano
10.787
-0.758
-6.56%
1 jan 2000 ano
12.048
+1.261
11.69%
1 jan 2001 ano
0.653
-11.395
-94.58%
1 jan 2002 ano
0.34
-0.313
-48.0%
1 jan 2003 ano
0.283
-0.057
-16.78%
1 jan 2004 ano
3.173
+2.89
1.02 mil%
1 jan 2005 ano
0.303
-2.87
-90.45%
1 jan 2006 ano
0.822
+0.519
171.33%
1 jan 2007 ano
0.895
+0.073
8.85%
1 jan 2008 ano
1.301
+0.406
45.37%
1 jan 2009 ano
7.762
+6.462
496.85%
1 jan 2010 ano
1.492
-6.27
-80.78%
1 jan 2011 ano
1.6
+0.108
7.27%
1 jan 2012 ano
1.365
-0.236
-14.73%
1 jan 2013 ano
1.587
+0.222
16.26%
1 jan 2014 ano
1.727
+0.14
8.83%
1 jan 2015 ano
1.481
-0.246
-14.23%
Classificação de países por estatísticas atuais por anos


Comentários: