29
/pt/
pt
AIzaSyAYiBZKx7MnpbEhh9jyipgxe19OcubqV5w
April 1, 2024
60004
Sub-Saharan Africa (excluding high income)
SSA
false
2
1
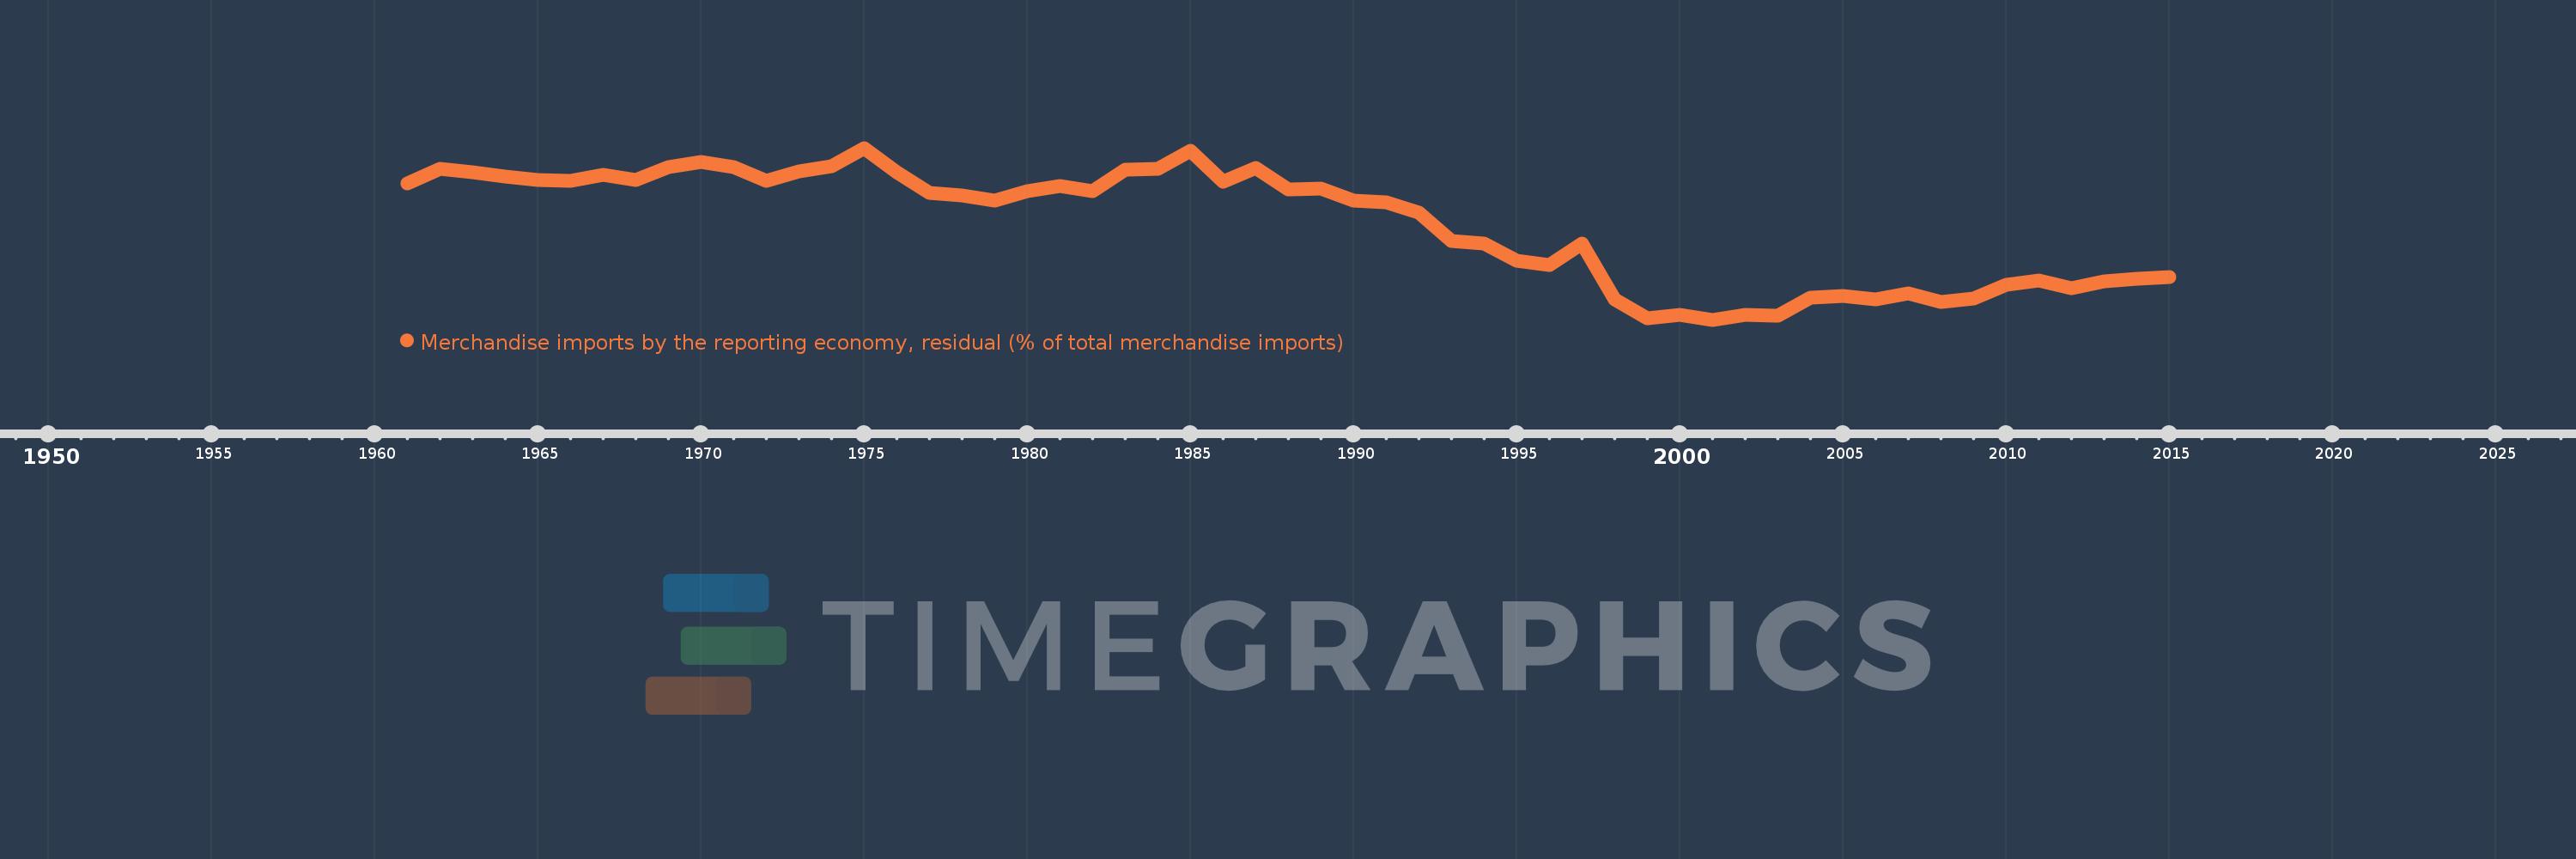
Merchandise imports by the reporting economy, residual (% of total merchandise imports)
2015,2014,2013,2012,2011,2010,2009,2008,2007,2006,2005,2004,2003,2002,2001,2000,1999,1998,1997,1996,1995,1994,1993,1992,1991,1990,1989,1988,1987,1986,1985,1984,1983,1982,1981,1980,1979,1978,1977,1976,1975,1974,1973,1972,1971,1970,1969,1968,1967,1966,1965,1964,1963,1962,1961
Estas estatísticas em outros países:
AfghanistanAlbaniaAlgeriaAmerican SamoaAngolaAntigua and BarbudaArab WorldArgentinaArmeniaArubaAustraliaAustriaAzerbaijanBahamas, TheBahrainBangladeshBarbadosBelarusBelgiumBelizeBeninBermudaBoliviaBosnia and HerzegovinaBrazilBrunei DarussalamBulgariaBurkina FasoBurundiCabo VerdeCambodiaCameroonCanadaCaribbean small statesCentral African RepublicCentral Europe and the BalticsChadChileChinaColombiaComorosCongo, Dem. Rep.Congo, Rep.Costa RicaCote d'IvoireCroatiaCubaCyprusCzech RepublicDenmarkDjiboutiDominicaDominican RepublicEarly-demographic dividendEast Asia & PacificEast Asia & Pacific (excluding high income)East Asia & Pacific (IDA & IBRD countries)EcuadorEgypt, Arab Rep.El SalvadorEquatorial GuineaEstoniaEthiopiaEuro areaEurope & Central AsiaEurope & Central Asia (excluding high income)Europe & Central Asia (IDA & IBRD countries)European UnionFaroe IslandsFijiFinlandFragile and conflict affected situationsFranceFrench PolynesiaGabonGambia, TheGeorgiaGermanyGhanaGibraltarGreeceGreenlandGrenadaGuamGuatemalaGuineaGuinea-BissauGuyanaHaitiHeavily indebted poor countries (HIPC)High incomeHondurasHong Kong SAR, ChinaHungaryIBRD onlyIcelandIDA & IBRD totalIDA blendIDA onlyIDA totalIndiaIndonesiaIran, Islamic Rep.IraqIrelandIsraelItalyJamaicaJapanJordanKazakhstanKenyaKiribatiKorea, Dem. People’s Rep.Korea, Rep.KosovoKuwaitKyrgyz RepublicLao PDRLate-demographic dividendLatin America & Caribbean Latin America & Caribbean (excluding high income)Latin America & the Caribbean (IDA & IBRD countries)LatviaLeast developed countries: UN classificationLebanonLiberiaLibyaLithuaniaLow & middle incomeLow incomeLower middle incomeLuxembourgMacao SAR, ChinaMacedonia, FYRMadagascarMalawiMalaysiaMaldivesMaliMaltaMauritaniaMauritiusMexicoMiddle East & North AfricaMiddle East & North Africa (excluding high income)Middle East & North Africa (IDA & IBRD countries)Middle incomeMoldovaMongoliaMontenegroMoroccoMozambiqueMyanmarNauruNepalNetherlandsNew CaledoniaNew ZealandNicaraguaNigerNigeriaNorth AmericaNorwayOECD membersOmanOther small statesPacific island small statesPakistanPanamaPapua New GuineaParaguayPeruPhilippinesPolandPortugalPost-demographic dividendPre-demographic dividendQatarRomaniaRussian FederationRwandaSamoaSao Tome and PrincipeSaudi ArabiaSenegalSerbiaSeychellesSierra LeoneSingaporeSlovak RepublicSloveniaSmall statesSolomon IslandsSomaliaSouth AfricaSouth AsiaSouth Asia (IDA & IBRD)SpainSri LankaSt. Kitts and NevisSt. LuciaSt. Vincent and the GrenadinesSub-Saharan Africa Sub-Saharan Africa (excluding high income)Sub-Saharan Africa (IDA & IBRD countries)SudanSurinameSwedenSwitzerlandSyrian Arab RepublicTajikistanTanzaniaThailandTogoTongaTrinidad and TobagoTunisiaTurkeyTurkmenistanTuvaluUgandaUkraineUnited Arab EmiratesUnited KingdomUnited StatesUpper middle incomeUruguayUzbekistanVanuatuVenezuela, RBVietnamWorldYemen, Rep.ZambiaZimbabwe Linha do tempo:
Nesta escala de tempo está apresentado um gráfico de 1961 ano até 2015 ano Sub-Saharan Africa (excluding high income). Dados de 1960 ano ausente. O número de observações reais por data: 55.
Fonte (nome):
Indicadores de desenvolvimento mundial
Fonte (organização):
World Bank staff estimates based data from International Monetary Fund's Direction of Trade database.
Categorias:
Private Sector, Trade
Foi atualizado:
23 abr 2017 ano
Indicadores de alterações dos valores ao longo dos anos
Mínimo:
2.868
1 jan 2001 ano
Máximo:
18.715
1 jan 1975 ano
Na data de observação
Valor
Mudança absoluta
A alteração em relação ao valor anterior
1 jan 1961 ano
15.474
+15.474
0.0%
1 jan 1962 ano
16.77
+1.296
8.37%
1 jan 1963 ano
16.497
-0.273
-1.63%
1 jan 1964 ano
16.078
-0.419
-2.54%
1 jan 1965 ano
15.768
-0.31
-1.93%
1 jan 1966 ano
15.714
-0.054
-0.34%
1 jan 1967 ano
16.205
+0.491
3.12%
1 jan 1968 ano
15.77
-0.435
-2.68%
1 jan 1969 ano
16.913
+1.143
7.25%
1 jan 1970 ano
17.433
+0.519
3.07%
1 jan 1971 ano
16.972
-0.461
-2.64%
1 jan 1972 ano
15.667
-1.305
-7.69%
1 jan 1973 ano
16.531
+0.864
5.52%
1 jan 1974 ano
17.042
+0.511
3.09%
1 jan 1975 ano
18.715
+1.672
9.81%
1 jan 1976 ano
16.445
-2.27
-12.13%
1 jan 1977 ano
14.578
-1.867
-11.36%
1 jan 1978 ano
14.369
-0.209
-1.43%
1 jan 1979 ano
13.843
-0.525
-3.65%
1 jan 1980 ano
14.703
+0.86
6.21%
1 jan 1981 ano
15.172
+0.469
3.19%
1 jan 1982 ano
14.733
-0.439
-2.89%
1 jan 1983 ano
16.686
+1.953
13.26%
1 jan 1984 ano
16.811
+0.124
0.75%
1 jan 1985 ano
18.415
+1.604
9.54%
1 jan 1986 ano
15.608
-2.807
-15.24%
1 jan 1987 ano
16.832
+1.224
7.84%
1 jan 1988 ano
14.905
-1.927
-11.45%
1 jan 1989 ano
14.962
+0.057
0.38%
1 jan 1990 ano
13.883
-1.079
-7.21%
1 jan 1991 ano
13.679
-0.204
-1.47%
1 jan 1992 ano
12.749
-0.929
-6.8%
1 jan 1993 ano
10.163
-2.587
-20.29%
1 jan 1994 ano
9.87
-0.293
-2.88%
1 jan 1995 ano
8.308
-1.562
-15.82%
1 jan 1996 ano
7.901
-0.406
-4.89%
1 jan 1997 ano
9.918
+2.016
25.52%
1 jan 1998 ano
4.768
-5.15
-51.92%
1 jan 1999 ano
2.997
-1.771
-37.15%
1 jan 2000 ano
3.336
+0.339
11.32%
1 jan 2001 ano
2.868
-0.468
-14.03%
1 jan 2002 ano
3.344
+0.476
16.59%
1 jan 2003 ano
3.224
-0.12
-3.58%
1 jan 2004 ano
4.87
+1.645
51.04%
1 jan 2005 ano
5.072
+0.202
4.16%
1 jan 2006 ano
4.712
-0.36
-7.09%
1 jan 2007 ano
5.337
+0.625
13.26%
1 jan 2008 ano
4.503
-0.834
-15.63%
1 jan 2009 ano
4.789
+0.286
6.35%
1 jan 2010 ano
6.072
+1.283
26.79%
1 jan 2011 ano
6.451
+0.379
6.24%
1 jan 2012 ano
5.751
-0.7
-10.85%
1 jan 2013 ano
6.396
+0.644
11.21%
1 jan 2014 ano
6.665
+0.27
4.22%
1 jan 2015 ano
6.794
+0.128
1.93%
Classificação de países por estatísticas atuais por anos


Comentários: