29
/pt/
pt
AIzaSyAYiBZKx7MnpbEhh9jyipgxe19OcubqV5w
April 1, 2024
226167
Portugal
PRT
true
2
1
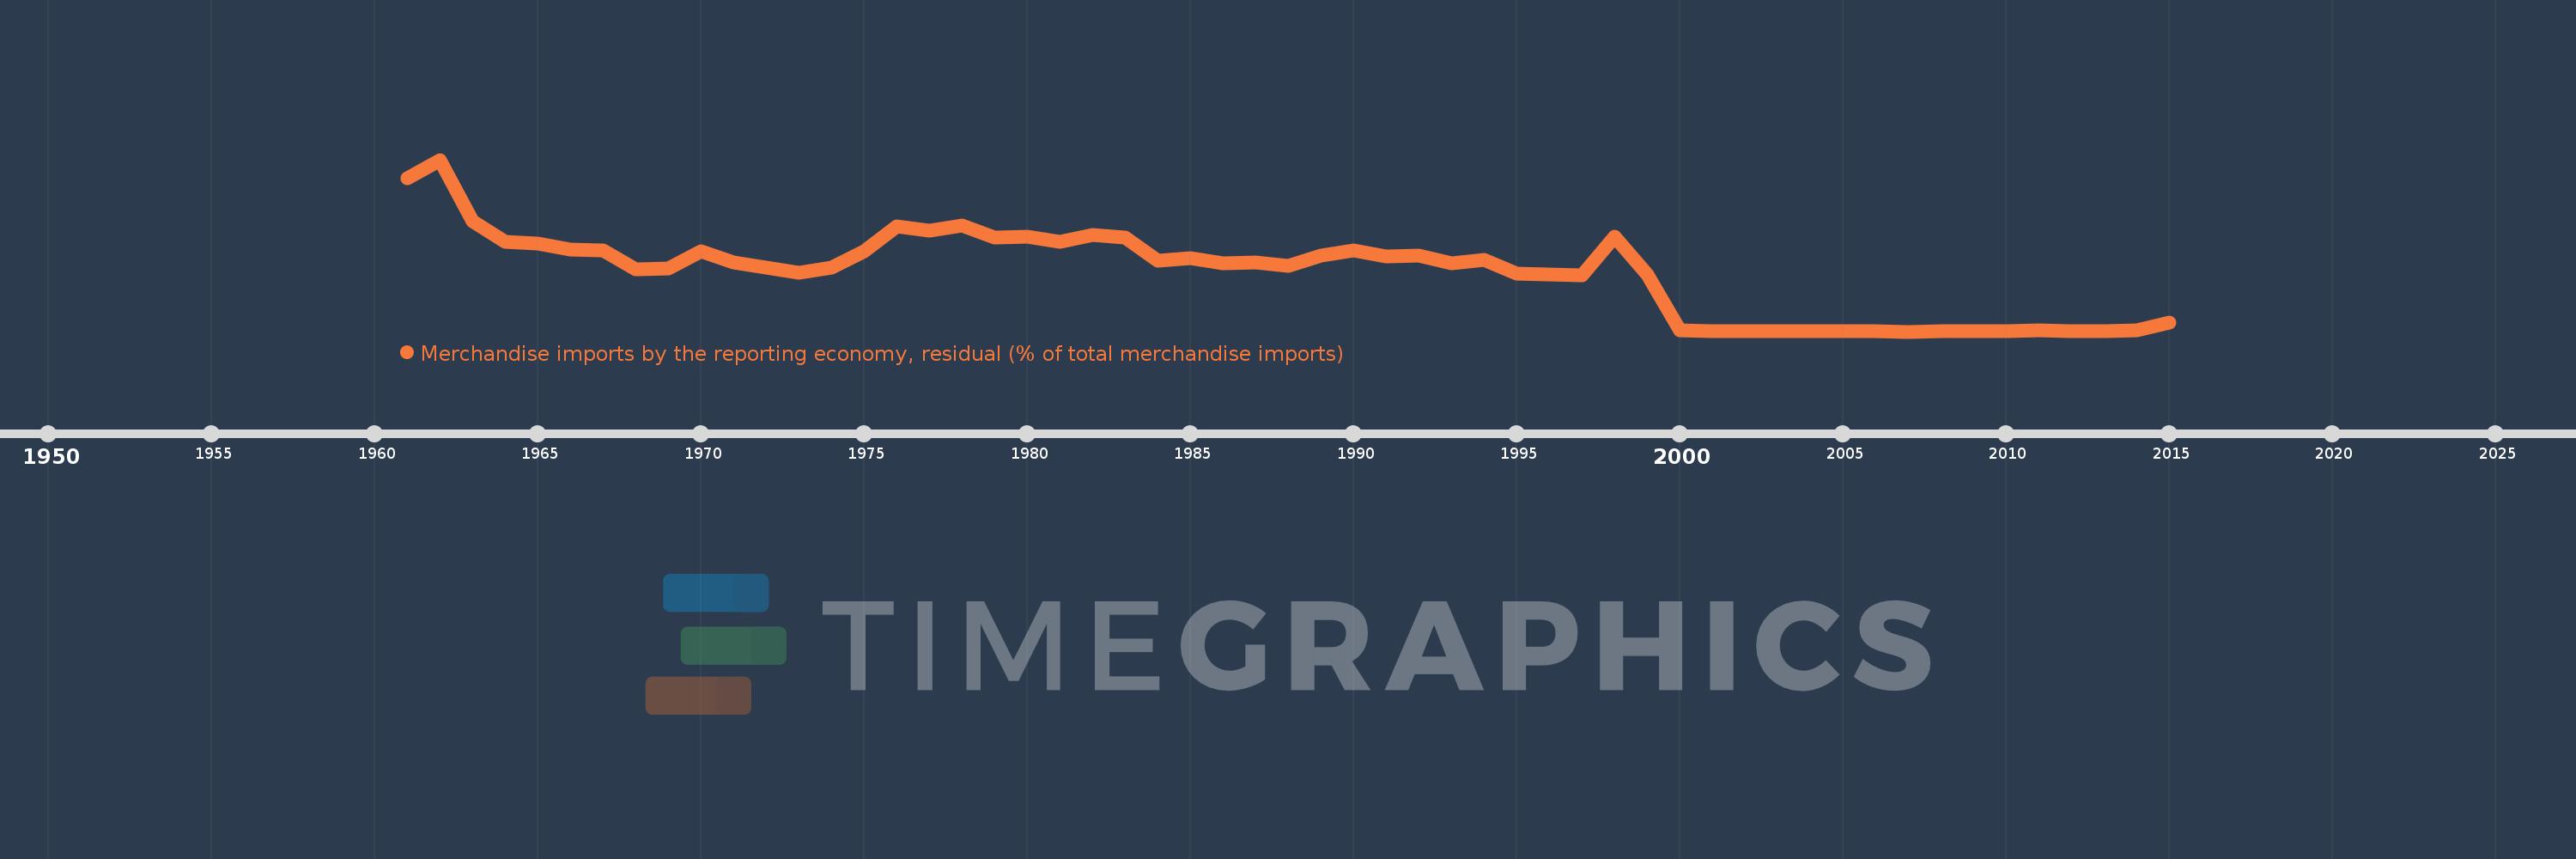
Merchandise imports by the reporting economy, residual (% of total merchandise imports)
2015,2014,2013,2012,2011,2010,2009,2008,2007,2006,2005,2004,2003,2002,2001,2000,1999,1998,1997,1996,1995,1994,1993,1992,1991,1990,1989,1988,1987,1986,1985,1984,1983,1982,1981,1980,1979,1978,1977,1976,1975,1974,1973,1972,1971,1970,1969,1968,1967,1966,1965,1964,1963,1962,1961
Estas estatísticas em outros países:
AfghanistanAlbaniaAlgeriaAmerican SamoaAngolaAntigua and BarbudaArab WorldArgentinaArmeniaArubaAustraliaAustriaAzerbaijanBahamas, TheBahrainBangladeshBarbadosBelarusBelgiumBelizeBeninBermudaBoliviaBosnia and HerzegovinaBrazilBrunei DarussalamBulgariaBurkina FasoBurundiCabo VerdeCambodiaCameroonCanadaCaribbean small statesCentral African RepublicCentral Europe and the BalticsChadChileChinaColombiaComorosCongo, Dem. Rep.Congo, Rep.Costa RicaCote d'IvoireCroatiaCubaCyprusCzech RepublicDenmarkDjiboutiDominicaDominican RepublicEarly-demographic dividendEast Asia & PacificEast Asia & Pacific (excluding high income)East Asia & Pacific (IDA & IBRD countries)EcuadorEgypt, Arab Rep.El SalvadorEquatorial GuineaEstoniaEthiopiaEuro areaEurope & Central AsiaEurope & Central Asia (excluding high income)Europe & Central Asia (IDA & IBRD countries)European UnionFaroe IslandsFijiFinlandFragile and conflict affected situationsFranceFrench PolynesiaGabonGambia, TheGeorgiaGermanyGhanaGibraltarGreeceGreenlandGrenadaGuamGuatemalaGuineaGuinea-BissauGuyanaHaitiHeavily indebted poor countries (HIPC)High incomeHondurasHong Kong SAR, ChinaHungaryIBRD onlyIcelandIDA & IBRD totalIDA blendIDA onlyIDA totalIndiaIndonesiaIran, Islamic Rep.IraqIrelandIsraelItalyJamaicaJapanJordanKazakhstanKenyaKiribatiKorea, Dem. People’s Rep.Korea, Rep.KosovoKuwaitKyrgyz RepublicLao PDRLate-demographic dividendLatin America & Caribbean Latin America & Caribbean (excluding high income)Latin America & the Caribbean (IDA & IBRD countries)LatviaLeast developed countries: UN classificationLebanonLiberiaLibyaLithuaniaLow & middle incomeLow incomeLower middle incomeLuxembourgMacao SAR, ChinaMacedonia, FYRMadagascarMalawiMalaysiaMaldivesMaliMaltaMauritaniaMauritiusMexicoMiddle East & North AfricaMiddle East & North Africa (excluding high income)Middle East & North Africa (IDA & IBRD countries)Middle incomeMoldovaMongoliaMontenegroMoroccoMozambiqueMyanmarNauruNepalNetherlandsNew CaledoniaNew ZealandNicaraguaNigerNigeriaNorth AmericaNorwayOECD membersOmanOther small statesPacific island small statesPakistanPanamaPapua New GuineaParaguayPeruPhilippinesPolandPortugalPost-demographic dividendPre-demographic dividendQatarRomaniaRussian FederationRwandaSamoaSao Tome and PrincipeSaudi ArabiaSenegalSerbiaSeychellesSierra LeoneSingaporeSlovak RepublicSloveniaSmall statesSolomon IslandsSomaliaSouth AfricaSouth AsiaSouth Asia (IDA & IBRD)SpainSri LankaSt. Kitts and NevisSt. LuciaSt. Vincent and the GrenadinesSub-Saharan Africa Sub-Saharan Africa (excluding high income)Sub-Saharan Africa (IDA & IBRD countries)SudanSurinameSwedenSwitzerlandSyrian Arab RepublicTajikistanTanzaniaThailandTogoTongaTrinidad and TobagoTunisiaTurkeyTurkmenistanTuvaluUgandaUkraineUnited Arab EmiratesUnited KingdomUnited StatesUpper middle incomeUruguayUzbekistanVanuatuVenezuela, RBVietnamWorldYemen, Rep.ZambiaZimbabwe Linha do tempo:
Nesta escala de tempo está apresentado um gráfico de 1961 ano até 2015 ano Portugal. Dados de 1960 ano ausente. O número de observações reais por data: 55.
Fonte (nome):
Indicadores de desenvolvimento mundial
Fonte (organização):
World Bank staff estimates based data from International Monetary Fund's Direction of Trade database.
Categorias:
Private Sector, Trade
Foi atualizado:
23 abr 2017 ano
Indicadores de alterações dos valores ao longo dos anos
Mínimo:
0.005
1 jan 2007 ano
Máximo:
10.503
1 jan 1962 ano
Na data de observação
Valor
Mudança absoluta
A alteração em relação ao valor anterior
1 jan 1961 ano
9.379
+9.379
0.0%
1 jan 1962 ano
10.503
+1.124
11.99%
1 jan 1963 ano
6.744
-3.759
-35.79%
1 jan 1964 ano
5.511
-1.233
-18.28%
1 jan 1965 ano
5.406
-0.105
-1.9%
1 jan 1966 ano
5.003
-0.403
-7.46%
1 jan 1967 ano
4.991
-0.012
-0.23%
1 jan 1968 ano
3.79
-1.201
-24.06%
1 jan 1969 ano
3.856
+0.065
1.73%
1 jan 1970 ano
4.93
+1.074
27.86%
1 jan 1971 ano
4.225
-0.705
-14.3%
1 jan 1972 ano
3.896
-0.329
-7.79%
1 jan 1973 ano
3.596
-0.301
-7.72%
1 jan 1974 ano
3.941
+0.345
9.59%
1 jan 1975 ano
4.92
+0.979
24.84%
1 jan 1976 ano
6.445
+1.525
31.0%
1 jan 1977 ano
6.162
-0.283
-4.39%
1 jan 1978 ano
6.495
+0.333
5.4%
1 jan 1979 ano
5.739
-0.756
-11.64%
1 jan 1980 ano
5.793
+0.054
0.95%
1 jan 1981 ano
5.505
-0.288
-4.97%
1 jan 1982 ano
5.892
+0.387
7.03%
1 jan 1983 ano
5.744
-0.148
-2.52%
1 jan 1984 ano
4.351
-1.393
-24.24%
1 jan 1985 ano
4.495
+0.144
3.31%
1 jan 1986 ano
4.195
-0.3
-6.67%
1 jan 1987 ano
4.224
+0.029
0.69%
1 jan 1988 ano
4.039
-0.185
-4.38%
1 jan 1989 ano
4.668
+0.629
15.58%
1 jan 1990 ano
4.959
+0.29
6.21%
1 jan 1991 ano
4.586
-0.372
-7.51%
1 jan 1992 ano
4.645
+0.059
1.28%
1 jan 1993 ano
4.201
-0.444
-9.56%
1 jan 1994 ano
4.377
+0.176
4.19%
1 jan 1995 ano
3.565
-0.812
-18.54%
1 jan 1996 ano
3.48
-0.086
-2.41%
1 jan 1997 ano
3.464
-0.016
-0.45%
1 jan 1998 ano
5.826
+2.362
68.19%
1 jan 1999 ano
3.511
-2.315
-39.74%
1 jan 2000 ano
0.084
-3.427
-97.6%
1 jan 2001 ano
0.047
-0.037
-43.68%
1 jan 2002 ano
0.02
-0.028
-58.81%
1 jan 2003 ano
0.015
-0.004
-21.24%
1 jan 2004 ano
0.013
-0.002
-16.02%
1 jan 2005 ano
0.008
-0.005
-41.19%
1 jan 2006 ano
0.024
+0.017
218.26%
1 jan 2007 ano
0.005
-0.019
-79.91%
1 jan 2008 ano
0.018
+0.013
267.8%
1 jan 2009 ano
0.015
-0.003
-17.23%
1 jan 2010 ano
0.023
+0.008
55.43%
1 jan 2011 ano
0.075
+0.052
228.25%
1 jan 2012 ano
0.024
-0.051
-68.09%
1 jan 2013 ano
0.049
+0.025
105.09%
1 jan 2014 ano
0.074
+0.024
49.66%
1 jan 2015 ano
0.537
+0.463
627.89%
Classificação de países por estatísticas atuais por anos


Comentários: