29
/pt/
pt
AIzaSyAYiBZKx7MnpbEhh9jyipgxe19OcubqV5w
April 1, 2024
143825
Guam
GUM
true
2
1
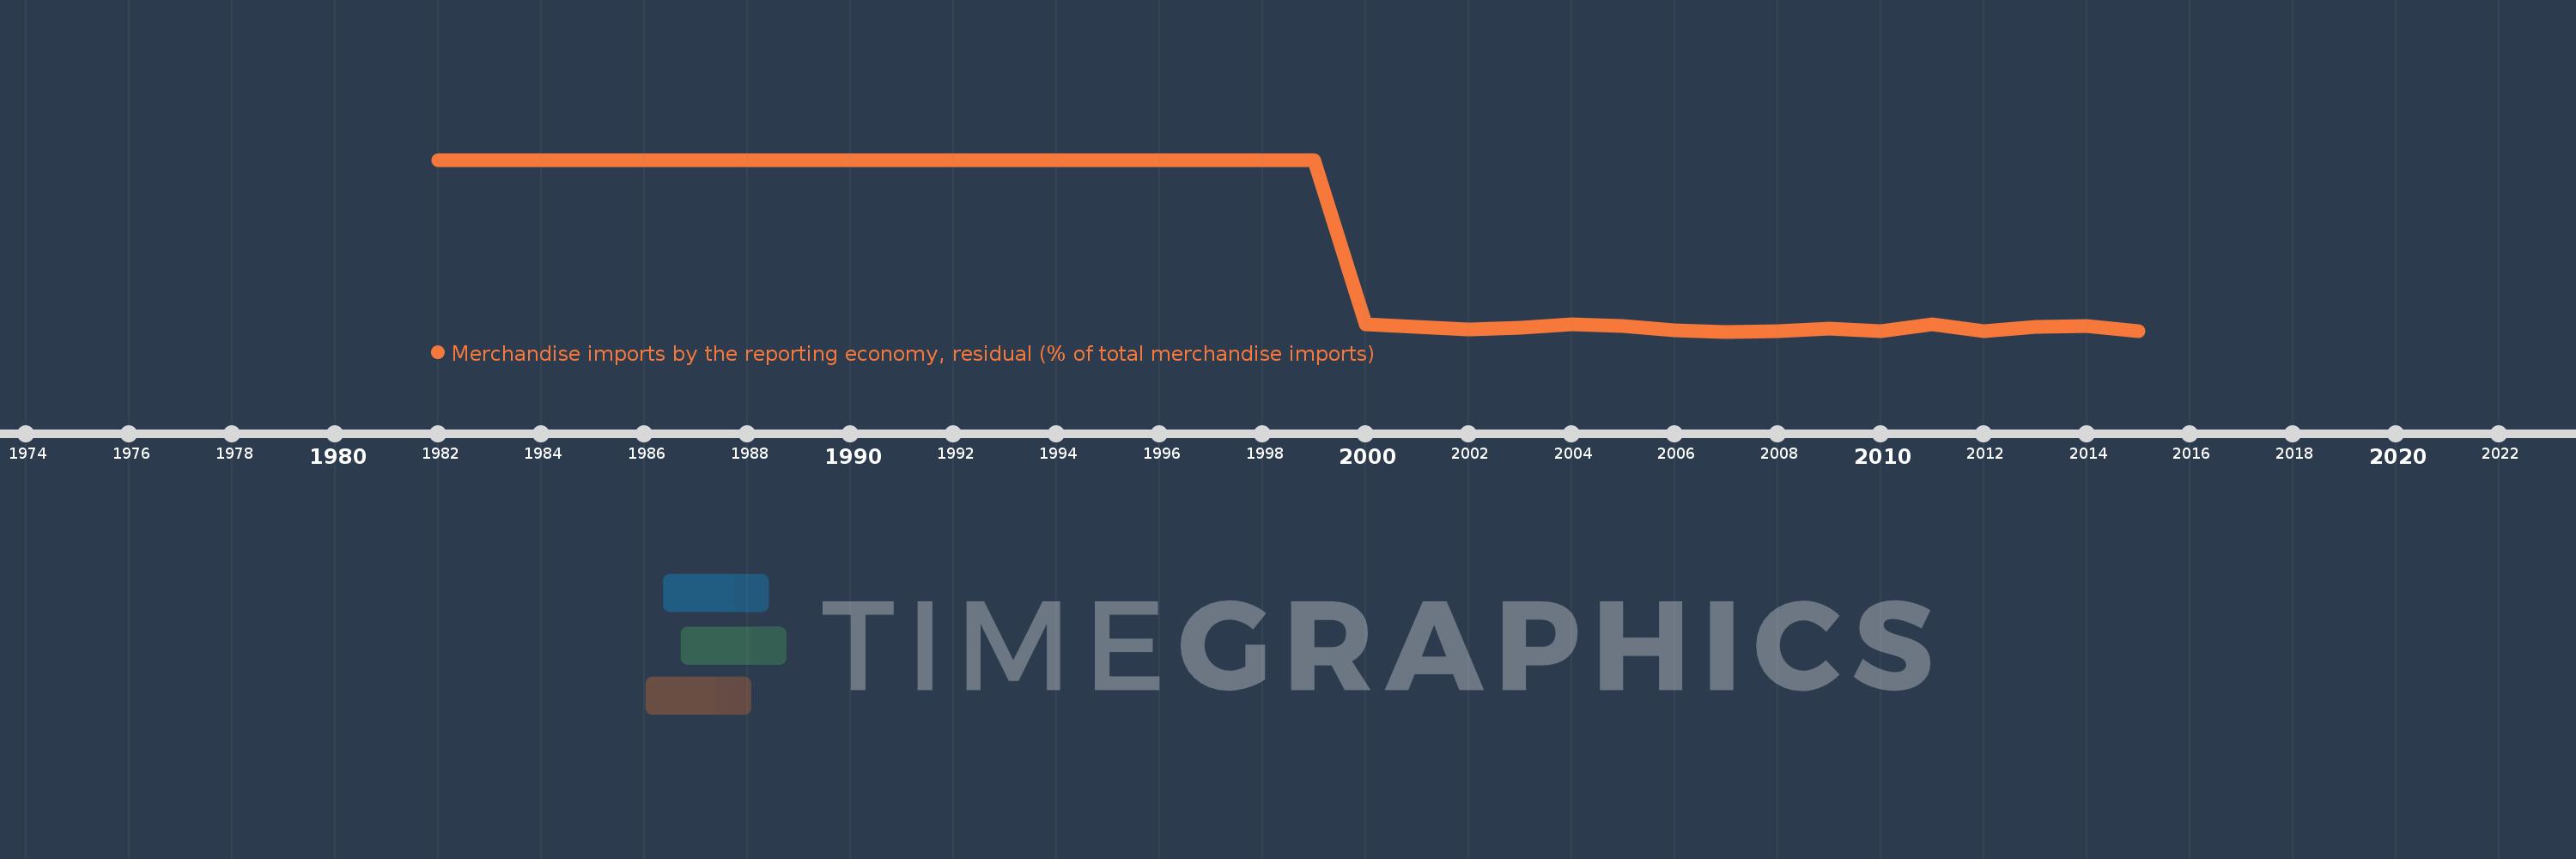
Merchandise imports by the reporting economy, residual (% of total merchandise imports)
2015,2014,2013,2012,2011,2010,2009,2008,2007,2006,2005,2004,2003,2002,2001,2000,1999,1998,1997,1996,1995,1994,1993,1992,1991,1990,1989,1988,1987,1986,1985,1984,1983,1982
Estas estatísticas em outros países:
AfghanistanAlbaniaAlgeriaAmerican SamoaAngolaAntigua and BarbudaArab WorldArgentinaArmeniaArubaAustraliaAustriaAzerbaijanBahamas, TheBahrainBangladeshBarbadosBelarusBelgiumBelizeBeninBermudaBoliviaBosnia and HerzegovinaBrazilBrunei DarussalamBulgariaBurkina FasoBurundiCabo VerdeCambodiaCameroonCanadaCaribbean small statesCentral African RepublicCentral Europe and the BalticsChadChileChinaColombiaComorosCongo, Dem. Rep.Congo, Rep.Costa RicaCote d'IvoireCroatiaCubaCyprusCzech RepublicDenmarkDjiboutiDominicaDominican RepublicEarly-demographic dividendEast Asia & PacificEast Asia & Pacific (excluding high income)East Asia & Pacific (IDA & IBRD countries)EcuadorEgypt, Arab Rep.El SalvadorEquatorial GuineaEstoniaEthiopiaEuro areaEurope & Central AsiaEurope & Central Asia (excluding high income)Europe & Central Asia (IDA & IBRD countries)European UnionFaroe IslandsFijiFinlandFragile and conflict affected situationsFranceFrench PolynesiaGabonGambia, TheGeorgiaGermanyGhanaGibraltarGreeceGreenlandGrenadaGuamGuatemalaGuineaGuinea-BissauGuyanaHaitiHeavily indebted poor countries (HIPC)High incomeHondurasHong Kong SAR, ChinaHungaryIBRD onlyIcelandIDA & IBRD totalIDA blendIDA onlyIDA totalIndiaIndonesiaIran, Islamic Rep.IraqIrelandIsraelItalyJamaicaJapanJordanKazakhstanKenyaKiribatiKorea, Dem. People’s Rep.Korea, Rep.KosovoKuwaitKyrgyz RepublicLao PDRLate-demographic dividendLatin America & Caribbean Latin America & Caribbean (excluding high income)Latin America & the Caribbean (IDA & IBRD countries)LatviaLeast developed countries: UN classificationLebanonLiberiaLibyaLithuaniaLow & middle incomeLow incomeLower middle incomeLuxembourgMacao SAR, ChinaMacedonia, FYRMadagascarMalawiMalaysiaMaldivesMaliMaltaMauritaniaMauritiusMexicoMiddle East & North AfricaMiddle East & North Africa (excluding high income)Middle East & North Africa (IDA & IBRD countries)Middle incomeMoldovaMongoliaMontenegroMoroccoMozambiqueMyanmarNauruNepalNetherlandsNew CaledoniaNew ZealandNicaraguaNigerNigeriaNorth AmericaNorwayOECD membersOmanOther small statesPacific island small statesPakistanPanamaPapua New GuineaParaguayPeruPhilippinesPolandPortugalPost-demographic dividendPre-demographic dividendQatarRomaniaRussian FederationRwandaSamoaSao Tome and PrincipeSaudi ArabiaSenegalSerbiaSeychellesSierra LeoneSingaporeSlovak RepublicSloveniaSmall statesSolomon IslandsSomaliaSouth AfricaSouth AsiaSouth Asia (IDA & IBRD)SpainSri LankaSt. Kitts and NevisSt. LuciaSt. Vincent and the GrenadinesSub-Saharan Africa Sub-Saharan Africa (excluding high income)Sub-Saharan Africa (IDA & IBRD countries)SudanSurinameSwedenSwitzerlandSyrian Arab RepublicTajikistanTanzaniaThailandTogoTongaTrinidad and TobagoTunisiaTurkeyTurkmenistanTuvaluUgandaUkraineUnited Arab EmiratesUnited KingdomUnited StatesUpper middle incomeUruguayUzbekistanVanuatuVenezuela, RBVietnamWorldYemen, Rep.ZambiaZimbabwe Linha do tempo:
Nesta escala de tempo está apresentado um gráfico de 1982 ano até 2015 ano Guam. Dados de 1981 ano ausente. O número de observações reais por data: 34.
Fonte (nome):
Indicadores de desenvolvimento mundial
Fonte (organização):
World Bank staff estimates based data from International Monetary Fund's Direction of Trade database.
Categorias:
Private Sector, Trade
Foi atualizado:
23 abr 2017 ano
Indicadores de alterações dos valores ao longo dos anos
Mínimo:
2.86
1 jan 2007 ano
Máximo:
100.0
1 jan 1982 ano
Na data de observação
Valor
Mudança absoluta
A alteração em relação ao valor anterior
1 jan 1982 ano
100.0
+100.0
0.0%
1 jan 1983 ano
100.0
0.0
0.0%
1 jan 1984 ano
100.0
0.0
0.0%
1 jan 1985 ano
100.0
0.0
0.0%
1 jan 1986 ano
100.0
0.0
0.0%
1 jan 1987 ano
100.0
0.0
0.0%
1 jan 1988 ano
100.0
0.0
0.0%
1 jan 1989 ano
100.0
0.0
0.0%
1 jan 1990 ano
100.0
0.0
0.0%
1 jan 1991 ano
100.0
0.0
0.0%
1 jan 1992 ano
100.0
0.0
0.0%
1 jan 1993 ano
100.0
0.0
0.0%
1 jan 1994 ano
100.0
0.0
0.0%
1 jan 1995 ano
100.0
0.0
0.0%
1 jan 1996 ano
100.0
0.0
0.0%
1 jan 1997 ano
100.0
0.0
0.0%
1 jan 1998 ano
100.0
0.0
0.0%
1 jan 1999 ano
100.0
0.0
0.0%
1 jan 2000 ano
6.822
-93.178
-93.18%
1 jan 2001 ano
5.378
-1.444
-21.16%
1 jan 2002 ano
4.192
-1.186
-22.05%
1 jan 2003 ano
5.105
+0.912
21.76%
1 jan 2004 ano
7.057
+1.952
38.24%
1 jan 2005 ano
6.231
-0.826
-11.71%
1 jan 2006 ano
3.805
-2.426
-38.94%
1 jan 2007 ano
2.86
-0.944
-24.82%
1 jan 2008 ano
3.302
+0.442
15.45%
1 jan 2009 ano
4.681
+1.379
41.75%
1 jan 2010 ano
3.303
-1.378
-29.43%
1 jan 2011 ano
7.036
+3.733
113.0%
1 jan 2012 ano
3.173
-3.863
-54.91%
1 jan 2013 ano
5.649
+2.477
78.07%
1 jan 2014 ano
6.251
+0.602
10.66%
1 jan 2015 ano
3.319
-2.933
-46.92%
Classificação de países por estatísticas atuais por anos


Comentários: