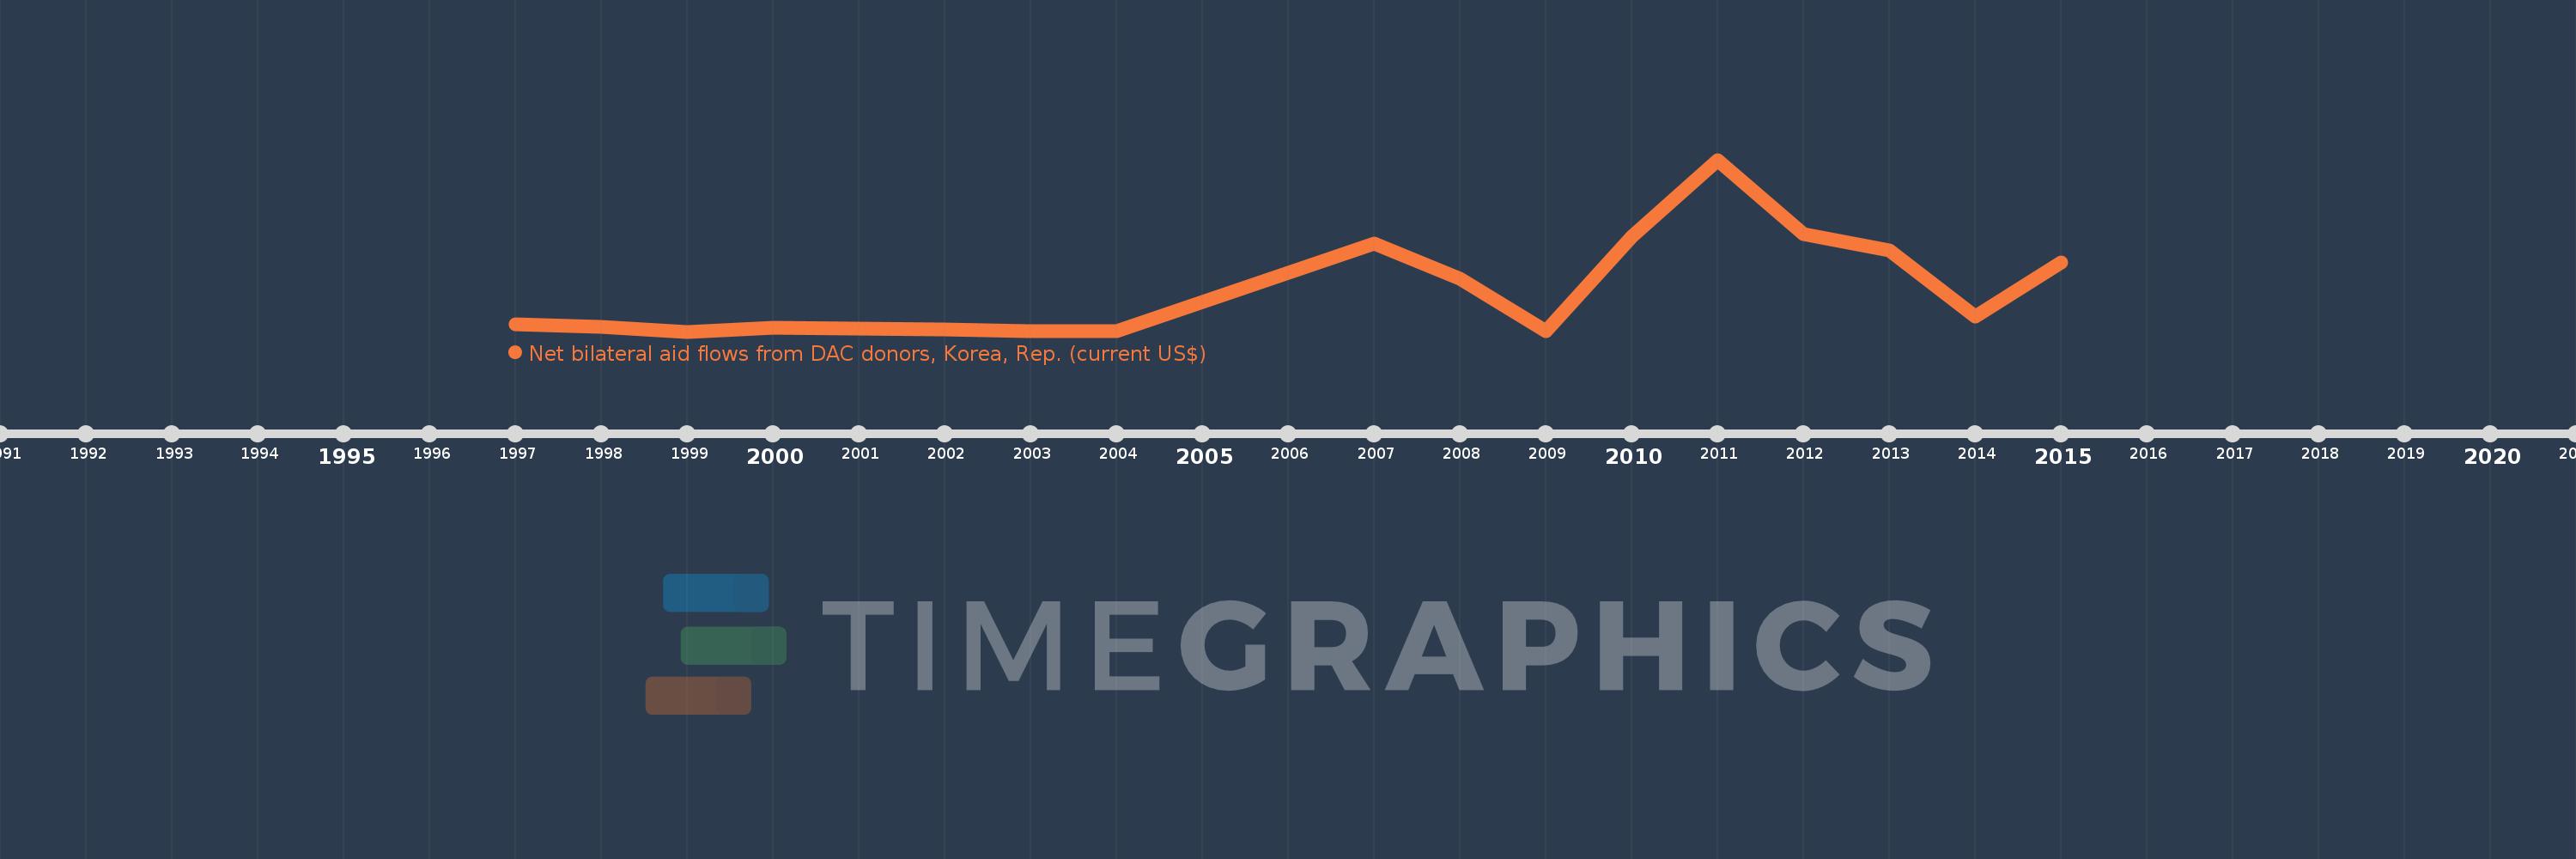
This timeline shows a graph from 1997 to 2015 of Bosnia and Herzegovina. No data until 1996. Number of actual observations by date: 17.
Source name:
World Development Indicators
Source organization:
Development Assistance Committee of the Organisation for Economic Co-operation and Development, Geographical Distribution of Financial Flows to Developing Countries, Development Co-operation Report, and International Development Statistics database. Data are available online at: www.oecd.org/dac/stats/idsonline.
Categories, topics:
Aid Effectiveness
Last updated:
apr 23, 2017
Indicators value changes by year
Meaning:
5.966 mln
Minimum:
10.0K
jan 1, 1999
Maximum:
25.13 mln
jan 1, 2011
At the date of observation
Value
Absolute change
Change from the previous value
jan 1, 1997
1.04 mln
+1.04 mln
0.0%
jan 1, 1998
720.0K
-320.0K
-30.77%
jan 1, 1999
10.0K
-710.0K
-98.61%
jan 1, 2000
560.0K
+550.0K
5.5K%
jan 1, 2001
430.0K
-130.0K
-23.21%
jan 1, 2002
350.0K
-80.0K
-18.6%
jan 1, 2003
20.0K
-330.0K
-94.29%
jan 1, 2004
50.0K
+30.0K
150.0%
jan 1, 2007
12.91 mln
+12.86 mln
25.72K%
jan 1, 2008
7.76 mln
-5.15 mln
-39.89%
jan 1, 2009
30.0K
-7.73 mln
-99.61%
jan 1, 2010
13.95 mln
+13.92 mln
46.4K%
jan 1, 2011
25.13 mln
+11.18 mln
80.14%
jan 1, 2012
14.22 mln
-10.91 mln
-43.41%
jan 1, 2013
11.84 mln
-2.38 mln
-16.74%
jan 1, 2014
2.25 mln
-9.59 mln
-81.0%
jan 1, 2015
10.16 mln
+7.91 mln
351.56%
Ranking of countries by current statistics by years