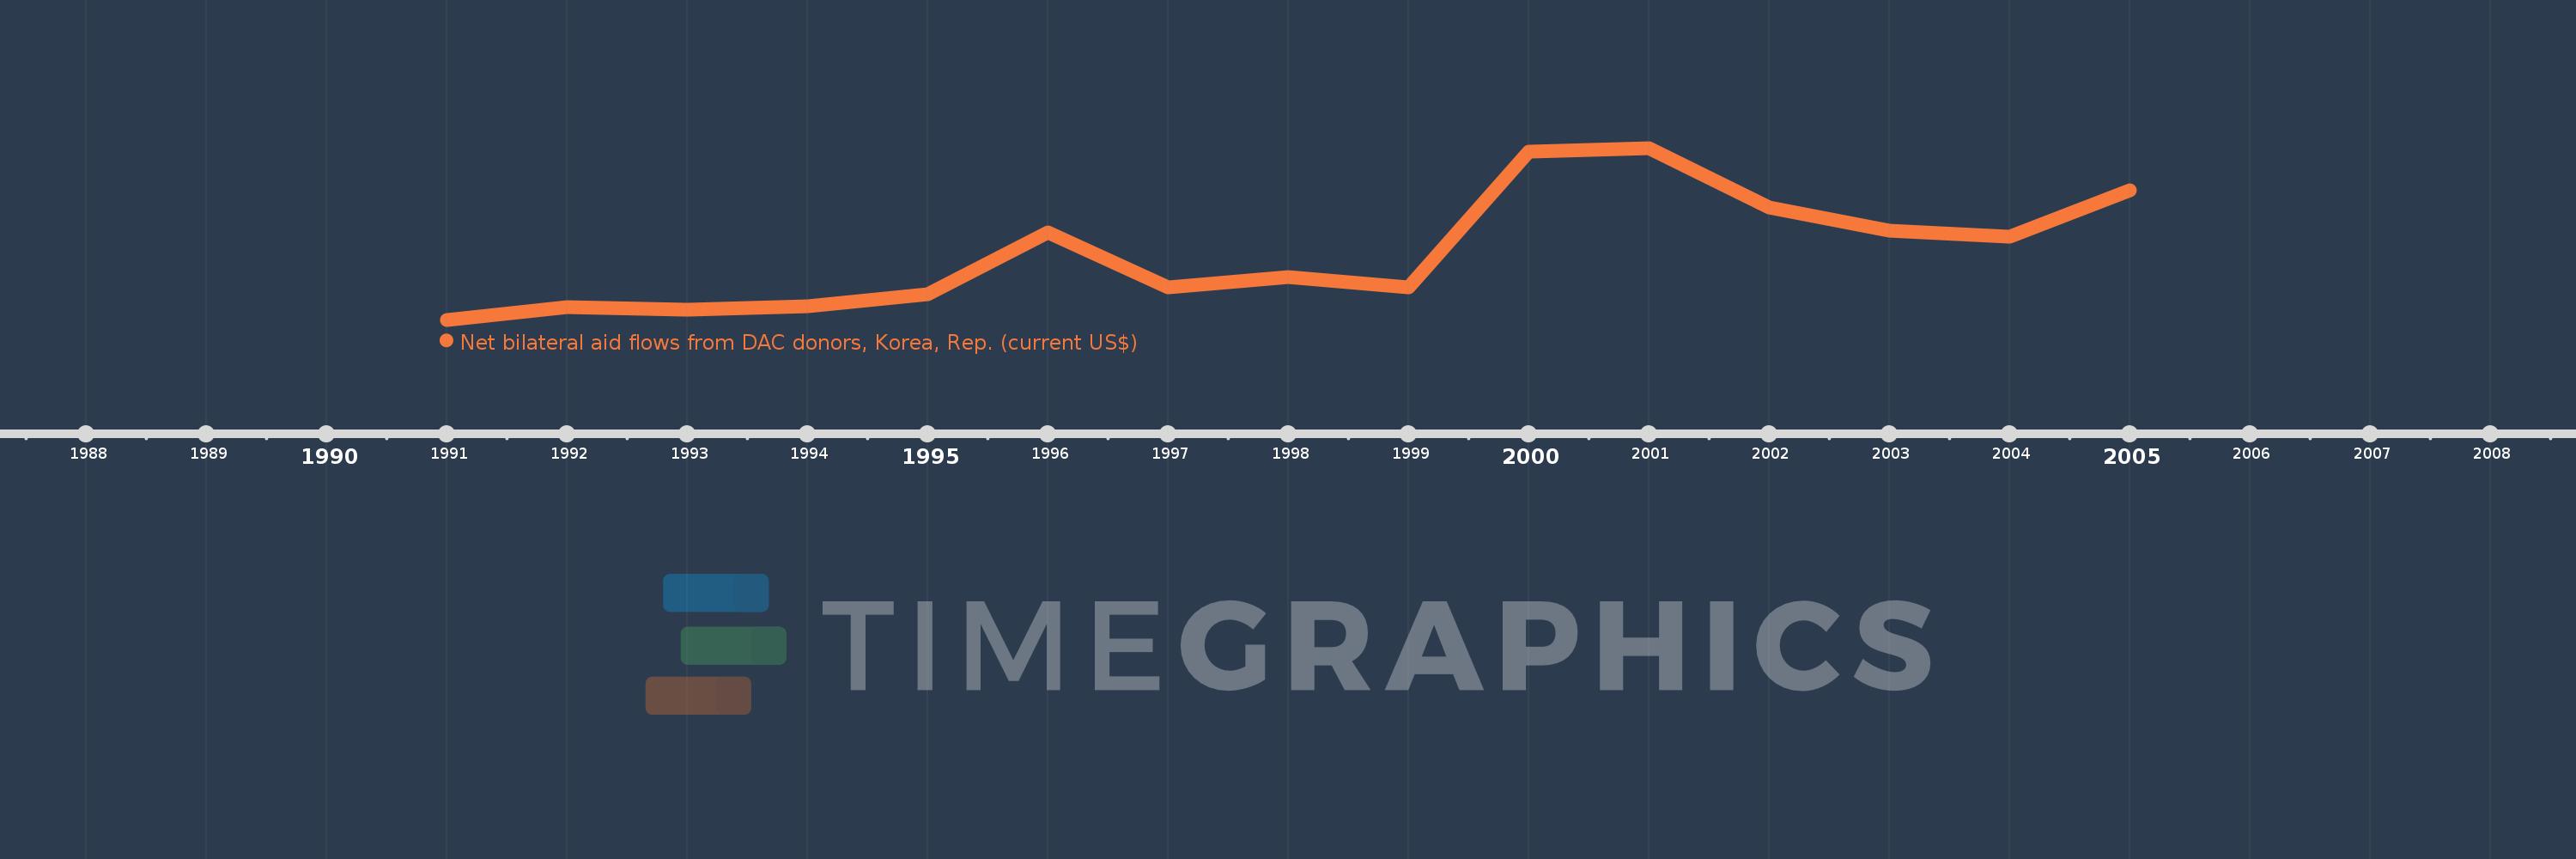
This timeline shows a graph from 1991 to 2005 of Russian Federation. No data until 1990. Number of actual observations by date: 15.
Source name:
World Development Indicators
Source organization:
Development Assistance Committee of the Organisation for Economic Co-operation and Development, Geographical Distribution of Financial Flows to Developing Countries, Development Co-operation Report, and International Development Statistics database. Data are available online at: www.oecd.org/dac/stats/idsonline.
Categories, topics:
Aid Effectiveness
Last updated:
apr 23, 2017
Indicators value changes by year
Meaning:
844.0K
Minimum:
20.0K
jan 1, 1991
Maximum:
2.12 mln
jan 1, 2001
At the date of observation
Value
Absolute change
Change from the previous value
jan 1, 1991
20.0K
+20.0K
0.0%
jan 1, 1992
170.0K
+150.0K
750.0%
jan 1, 1993
140.0K
-30.0K
-17.65%
jan 1, 1994
190.0K
+50.0K
35.71%
jan 1, 1995
330.0K
+140.0K
73.68%
jan 1, 1996
1.09 mln
+760.0K
230.3%
jan 1, 1997
420.0K
-670.0K
-61.47%
jan 1, 1998
540.0K
+120.0K
28.57%
jan 1, 1999
420.0K
-120.0K
-22.22%
jan 1, 2000
2.08 mln
+1.66 mln
395.24%
jan 1, 2001
2.12 mln
+40.0K
1.92%
jan 1, 2002
1.39 mln
-730.0K
-34.43%
jan 1, 2003
1.11 mln
-280.0K
-20.14%
jan 1, 2004
1.04 mln
-70.0K
-6.31%
jan 1, 2005
1.6 mln
+560.0K
53.85%
Ranking of countries by current statistics by years