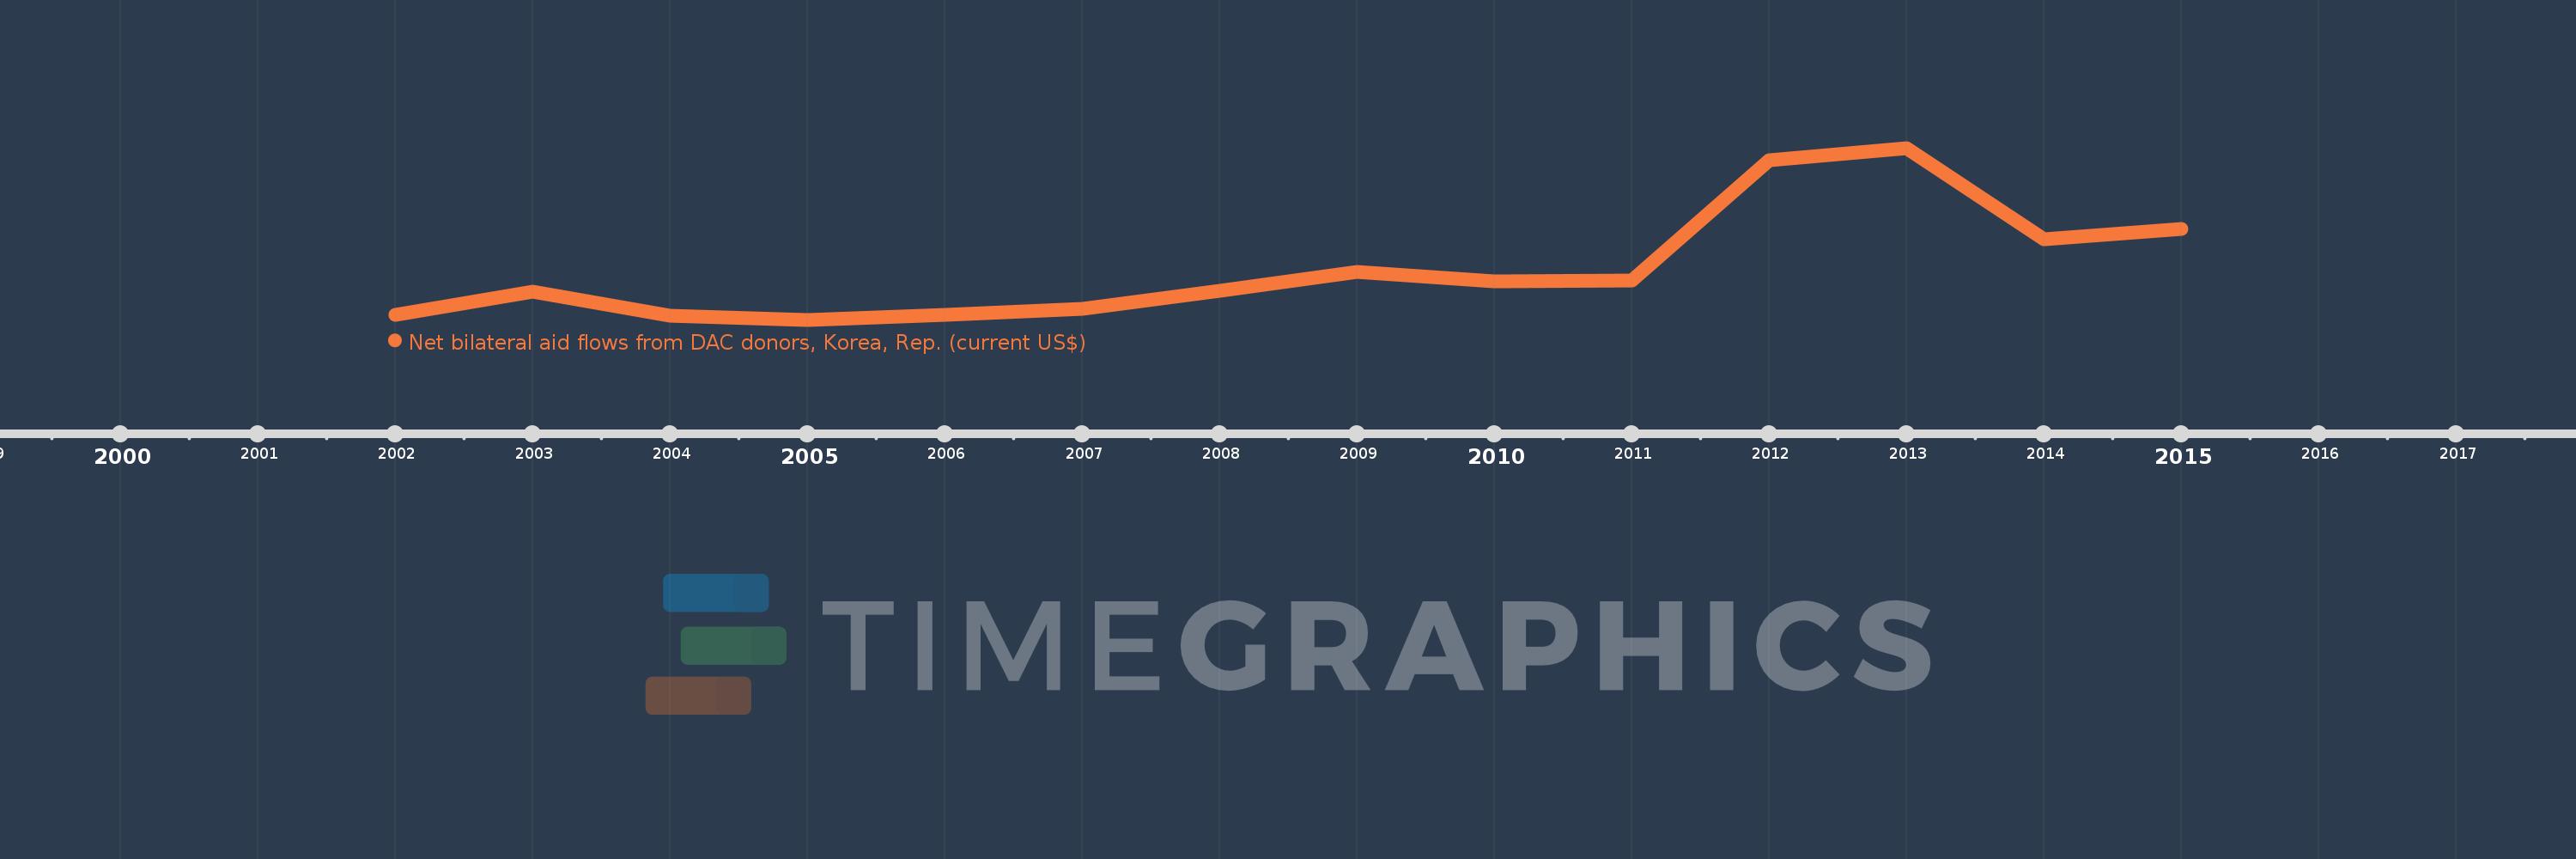
This timeline shows a graph from 2002 to 2015 of Timor-Leste. No data until 2001. Number of actual observations by date: 14.
Source name:
World Development Indicators
Source organization:
Development Assistance Committee of the Organisation for Economic Co-operation and Development, Geographical Distribution of Financial Flows to Developing Countries, Development Co-operation Report, and International Development Statistics database. Data are available online at: www.oecd.org/dac/stats/idsonline.
Categories, topics:
Aid Effectiveness
Last updated:
apr 23, 2017
Indicators value changes by year
Meaning:
2.298 mln
Minimum:
100.0K
jan 1, 2005
Maximum:
7.55 mln
jan 1, 2013
At the date of observation
Value
Absolute change
Change from the previous value
jan 1, 2002
300.0K
+300.0K
0.0%
jan 1, 2003
1.31 mln
+1.01 mln
336.67%
jan 1, 2004
270.0K
-1.04 mln
-79.39%
jan 1, 2005
100.0K
-170.0K
-62.96%
jan 1, 2006
300.0K
+200.0K
200.0%
jan 1, 2007
570.0K
+270.0K
90.0%
jan 1, 2008
1.36 mln
+790.0K
138.6%
jan 1, 2009
2.18 mln
+820.0K
60.29%
jan 1, 2010
1.77 mln
-410.0K
-18.81%
jan 1, 2011
1.82 mln
+50.0K
2.82%
jan 1, 2012
7.02 mln
+5.2 mln
285.71%
jan 1, 2013
7.55 mln
+530.0K
7.55%
jan 1, 2014
3.6 mln
-3.95 mln
-52.32%
jan 1, 2015
4.02 mln
+420.0K
11.67%
Ranking of countries by current statistics by years