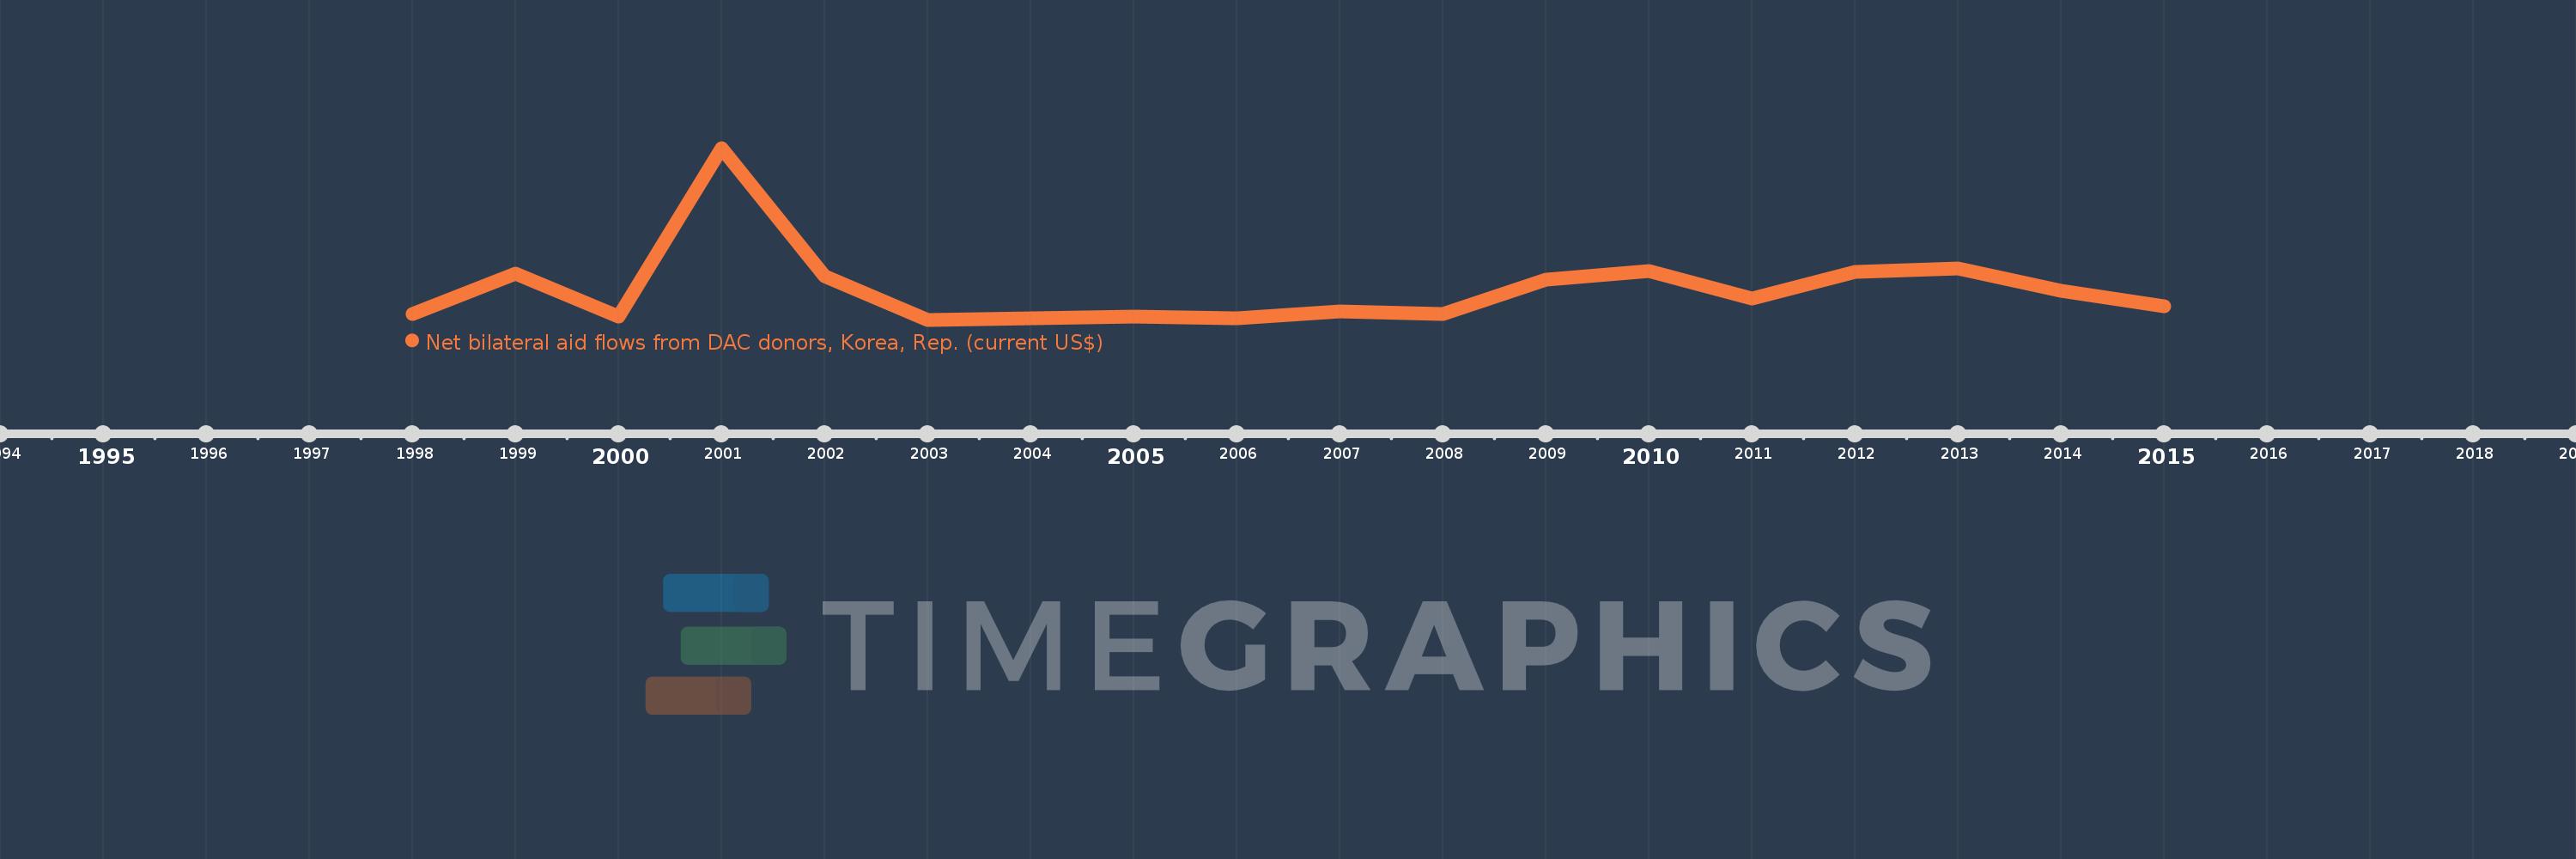
This timeline shows a graph from 1998 to 2015 of South Africa. No data until 1997. Number of actual observations by date: 18.
Source name:
World Development Indicators
Source organization:
Development Assistance Committee of the Organisation for Economic Co-operation and Development, Geographical Distribution of Financial Flows to Developing Countries, Development Co-operation Report, and International Development Statistics database. Data are available online at: www.oecd.org/dac/stats/idsonline.
Categories, topics:
Aid Effectiveness
Last updated:
apr 23, 2017
Indicators value changes by year
Meaning:
371.111K
Minimum:
50.0K
jan 1, 2003
Maximum:
1.88 mln
jan 1, 2001
At the date of observation
Value
Absolute change
Change from the previous value
jan 1, 1998
110.0K
+110.0K
0.0%
jan 1, 1999
540.0K
+430.0K
390.91%
jan 1, 2000
80.0K
-460.0K
-85.19%
jan 1, 2001
1.88 mln
+1.8 mln
2.25K%
jan 1, 2002
510.0K
-1.37 mln
-72.87%
jan 1, 2003
50.0K
-460.0K
-90.2%
jan 1, 2004
70.0K
+20.0K
40.0%
jan 1, 2005
80.0K
+10.0K
14.29%
jan 1, 2006
70.0K
-10.0K
-12.5%
jan 1, 2007
140.0K
+70.0K
100.0%
jan 1, 2008
110.0K
-30.0K
-21.43%
jan 1, 2009
480.0K
+370.0K
336.36%
jan 1, 2010
570.0K
+90.0K
18.75%
jan 1, 2011
280.0K
-290.0K
-50.88%
jan 1, 2012
560.0K
+280.0K
100.0%
jan 1, 2013
600.0K
+40.0K
7.14%
jan 1, 2014
360.0K
-240.0K
-40.0%
jan 1, 2015
190.0K
-170.0K
-47.22%
Ranking of countries by current statistics by years