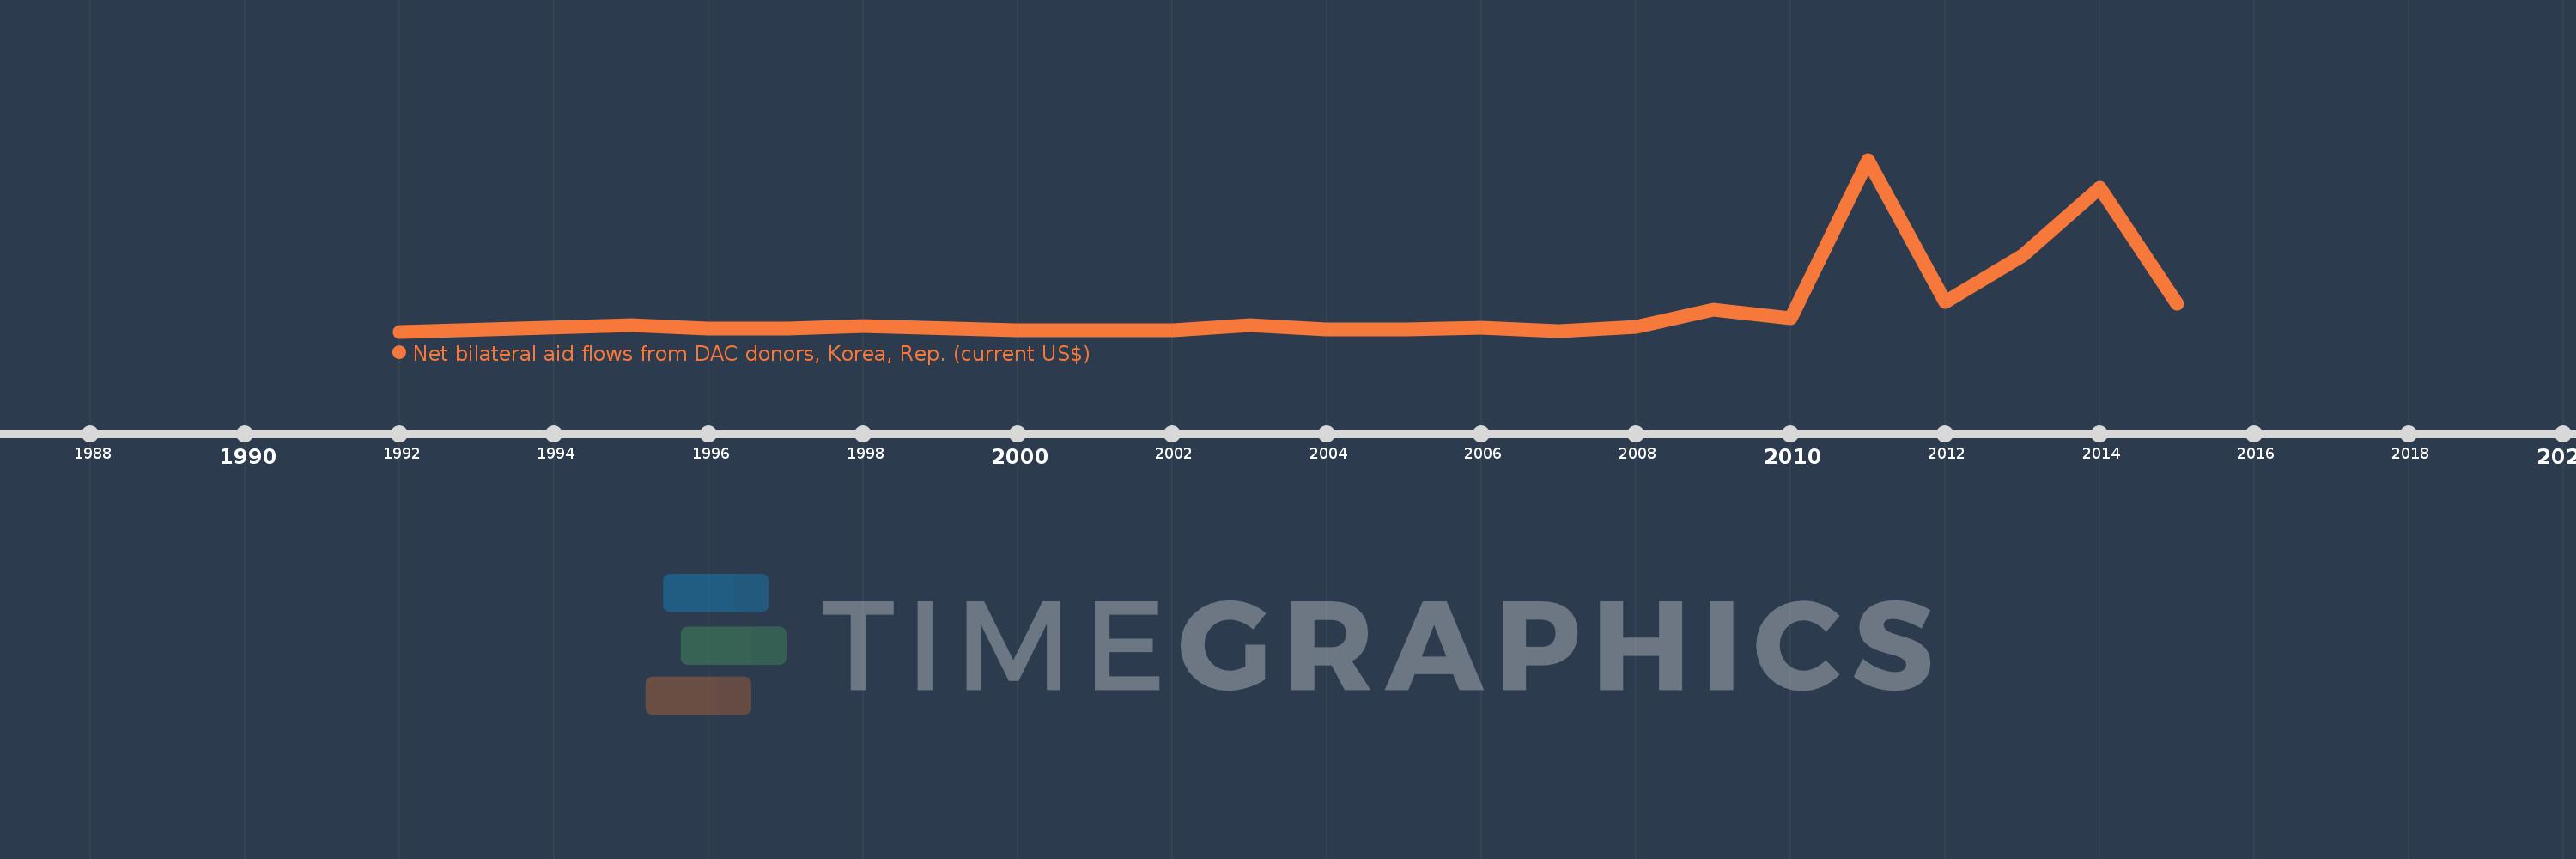
This timeline shows a graph from 1992 to 2015 of Haiti. No data until 1991. Number of actual observations by date: 20.
Source name:
World Development Indicators
Source organization:
Development Assistance Committee of the Organisation for Economic Co-operation and Development, Geographical Distribution of Financial Flows to Developing Countries, Development Co-operation Report, and International Development Statistics database. Data are available online at: www.oecd.org/dac/stats/idsonline.
Categories, topics:
Aid Effectiveness
Last updated:
apr 23, 2017
Indicators value changes by year
Meaning:
853.0K
Minimum:
10.0K
jan 1, 1992
Maximum:
5.54 mln
jan 1, 2011
At the date of observation
Value
Absolute change
Change from the previous value
jan 1, 1992
10.0K
+10.0K
0.0%
jan 1, 1995
220.0K
+210.0K
2.1K%
jan 1, 1996
100.0K
-120.0K
-54.55%
jan 1, 1997
100.0K
0.0
0.0%
jan 1, 1998
180.0K
+80.0K
80.0%
jan 1, 2000
40.0K
-140.0K
-77.78%
jan 1, 2002
40.0K
0.0
0.0%
jan 1, 2003
220.0K
+180.0K
450.0%
jan 1, 2004
80.0K
-140.0K
-63.64%
jan 1, 2005
90.0K
+10.0K
12.5%
jan 1, 2006
130.0K
+40.0K
44.44%
jan 1, 2007
30.0K
-100.0K
-76.92%
jan 1, 2008
150.0K
+120.0K
400.0%
jan 1, 2009
720.0K
+570.0K
380.0%
jan 1, 2010
430.0K
-290.0K
-40.28%
jan 1, 2011
5.54 mln
+5.11 mln
1.19K%
jan 1, 2012
970.0K
-4.57 mln
-82.49%
jan 1, 2013
2.45 mln
+1.48 mln
152.58%
jan 1, 2014
4.64 mln
+2.19 mln
89.39%
jan 1, 2015
920.0K
-3.72 mln
-80.17%
Ranking of countries by current statistics by years