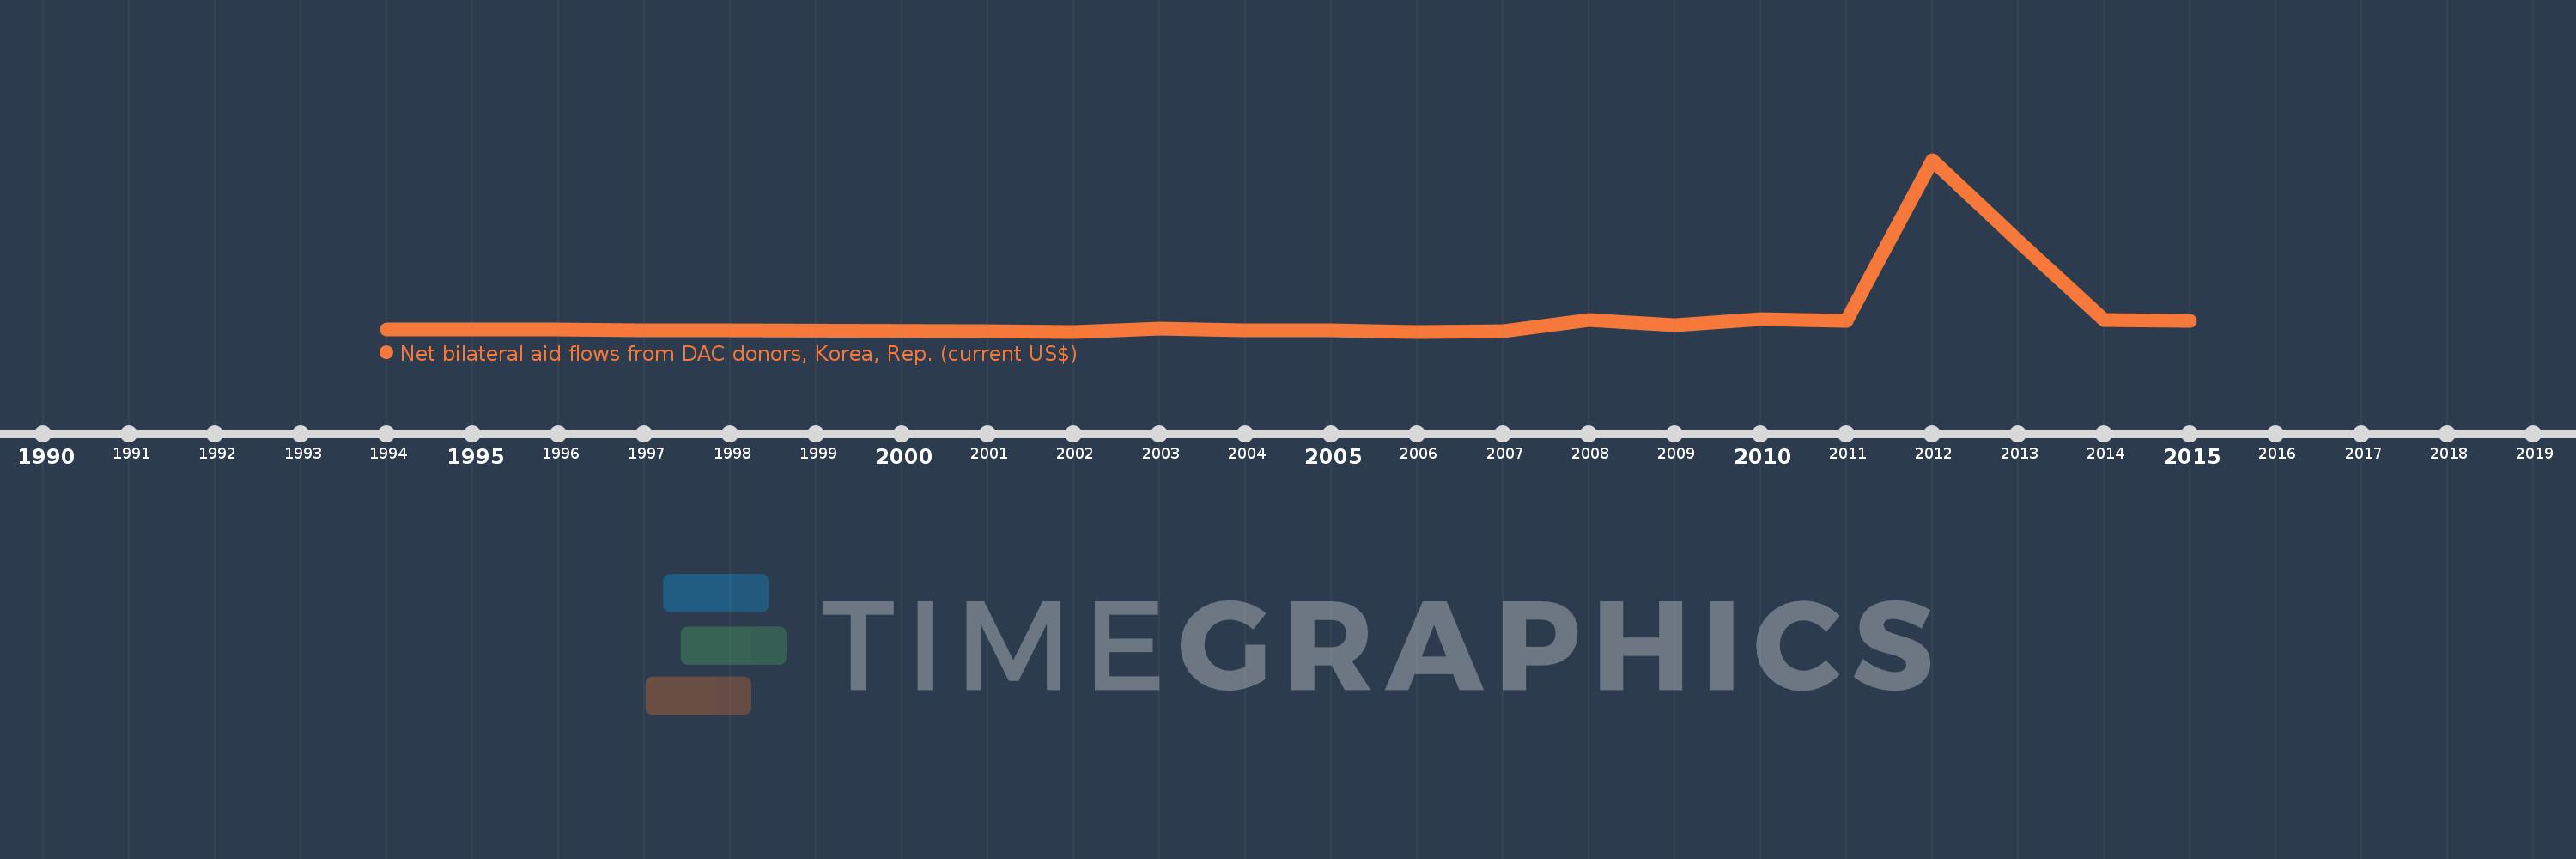
This timeline shows a graph from 1994 to 2015 of Madagascar. No data until 1993. Number of actual observations by date: 20.
Source name:
World Development Indicators
Source organization:
Development Assistance Committee of the Organisation for Economic Co-operation and Development, Geographical Distribution of Financial Flows to Developing Countries, Development Co-operation Report, and International Development Statistics database. Data are available online at: www.oecd.org/dac/stats/idsonline.
Categories, topics:
Aid Effectiveness
Last updated:
apr 23, 2017
Indicators value changes by year
Meaning:
774.5K
Minimum:
20.0K
jan 1, 2002
Maximum:
7.61 mln
jan 1, 2012
At the date of observation
Value
Absolute change
Change from the previous value
jan 1, 1994
110.0K
+110.0K
0.0%
jan 1, 1995
100.0K
-10.0K
-9.09%
jan 1, 1996
130.0K
+30.0K
30.0%
jan 1, 1997
90.0K
-40.0K
-30.77%
jan 1, 1998
90.0K
0.0
0.0%
jan 1, 2001
30.0K
-60.0K
-66.67%
jan 1, 2002
20.0K
-10.0K
-33.33%
jan 1, 2003
150.0K
+130.0K
650.0%
jan 1, 2004
80.0K
-70.0K
-46.67%
jan 1, 2005
80.0K
0.0
0.0%
jan 1, 2006
20.0K
-60.0K
-75.0%
jan 1, 2007
50.0K
+30.0K
150.0%
jan 1, 2008
520.0K
+470.0K
940.0%
jan 1, 2009
310.0K
-210.0K
-40.38%
jan 1, 2010
560.0K
+250.0K
80.65%
jan 1, 2011
510.0K
-50.0K
-8.93%
jan 1, 2012
7.61 mln
+7.1 mln
1.39K%
jan 1, 2013
4.01 mln
-3.6 mln
-47.31%
jan 1, 2014
520.0K
-3.49 mln
-87.03%
jan 1, 2015
500.0K
-20.0K
-3.85%
Ranking of countries by current statistics by years