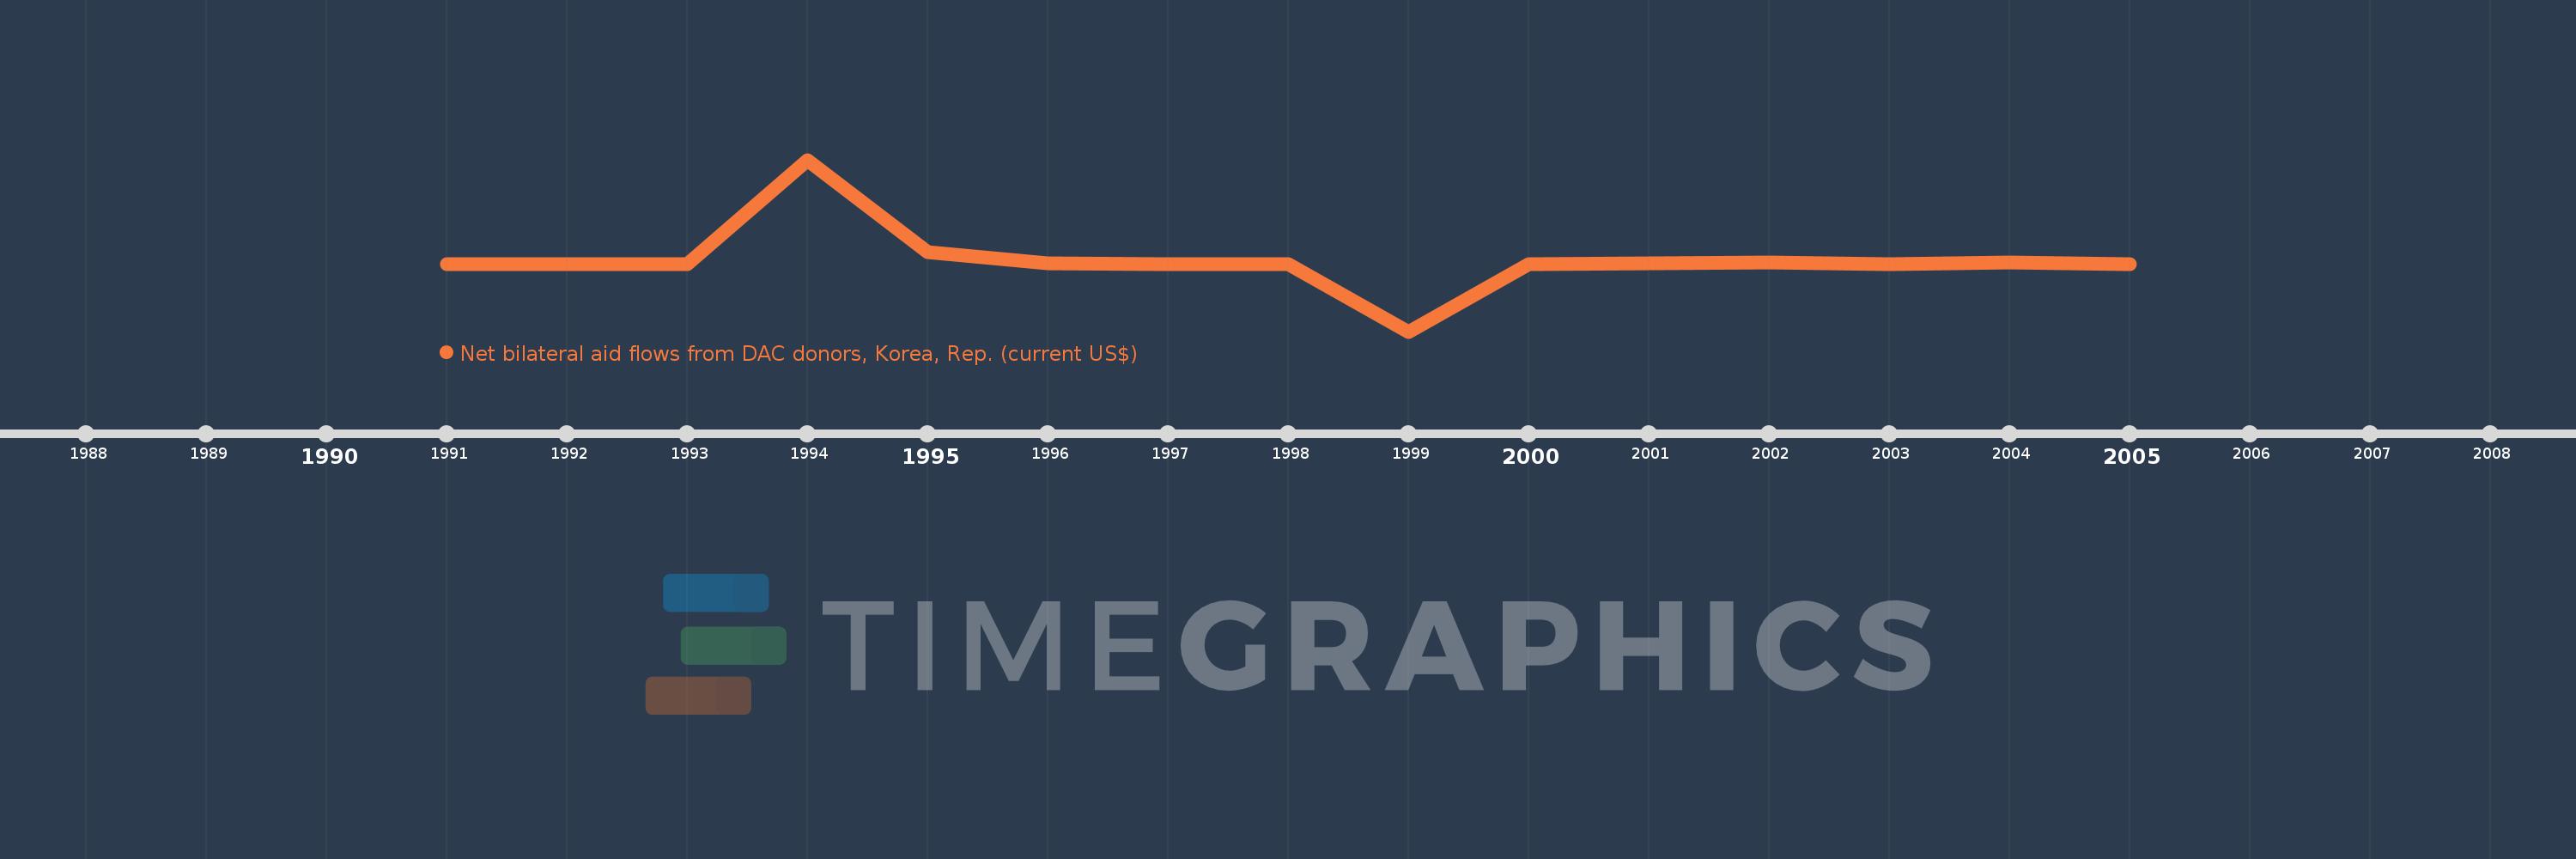
This timeline shows a graph from 1991 to 2005 of Poland. No data until 1990. Number of actual observations by date: 15.
Source name:
World Development Indicators
Source organization:
Development Assistance Committee of the Organisation for Economic Co-operation and Development, Geographical Distribution of Financial Flows to Developing Countries, Development Co-operation Report, and International Development Statistics database. Data are available online at: www.oecd.org/dac/stats/idsonline.
Categories, topics:
Aid Effectiveness
Last updated:
apr 23, 2017
Indicators value changes by year
Meaning:
1.531 mln
Minimum:
-27.26 mln
jan 1, 1999
Maximum:
42.24 mln
jan 1, 1994
At the date of observation
Value
Absolute change
Change from the previous value
jan 1, 1991
30.0K
+30.0K
0.0%
jan 1, 1992
40.0K
+10.0K
33.33%
jan 1, 1993
70.0K
+30.0K
75.0%
jan 1, 1994
42.24 mln
+42.17 mln
60.24K%
jan 1, 1995
4.96 mln
-37.28 mln
-88.26%
jan 1, 1996
390.0K
-4.57 mln
-92.14%
jan 1, 1997
180.0K
-210.0K
-53.85%
jan 1, 1998
50.0K
-130.0K
-72.22%
jan 1, 1999
-27.26 mln
-27.31 mln
-54.62K%
jan 1, 2000
90.0K
+27.35 mln
-100.33%
jan 1, 2001
340.0K
+250.0K
277.78%
jan 1, 2002
810.0K
+470.0K
138.24%
jan 1, 2003
150.0K
-660.0K
-81.48%
jan 1, 2004
740.0K
+590.0K
393.33%
jan 1, 2005
130.0K
-610.0K
-82.43%
Ranking of countries by current statistics by years