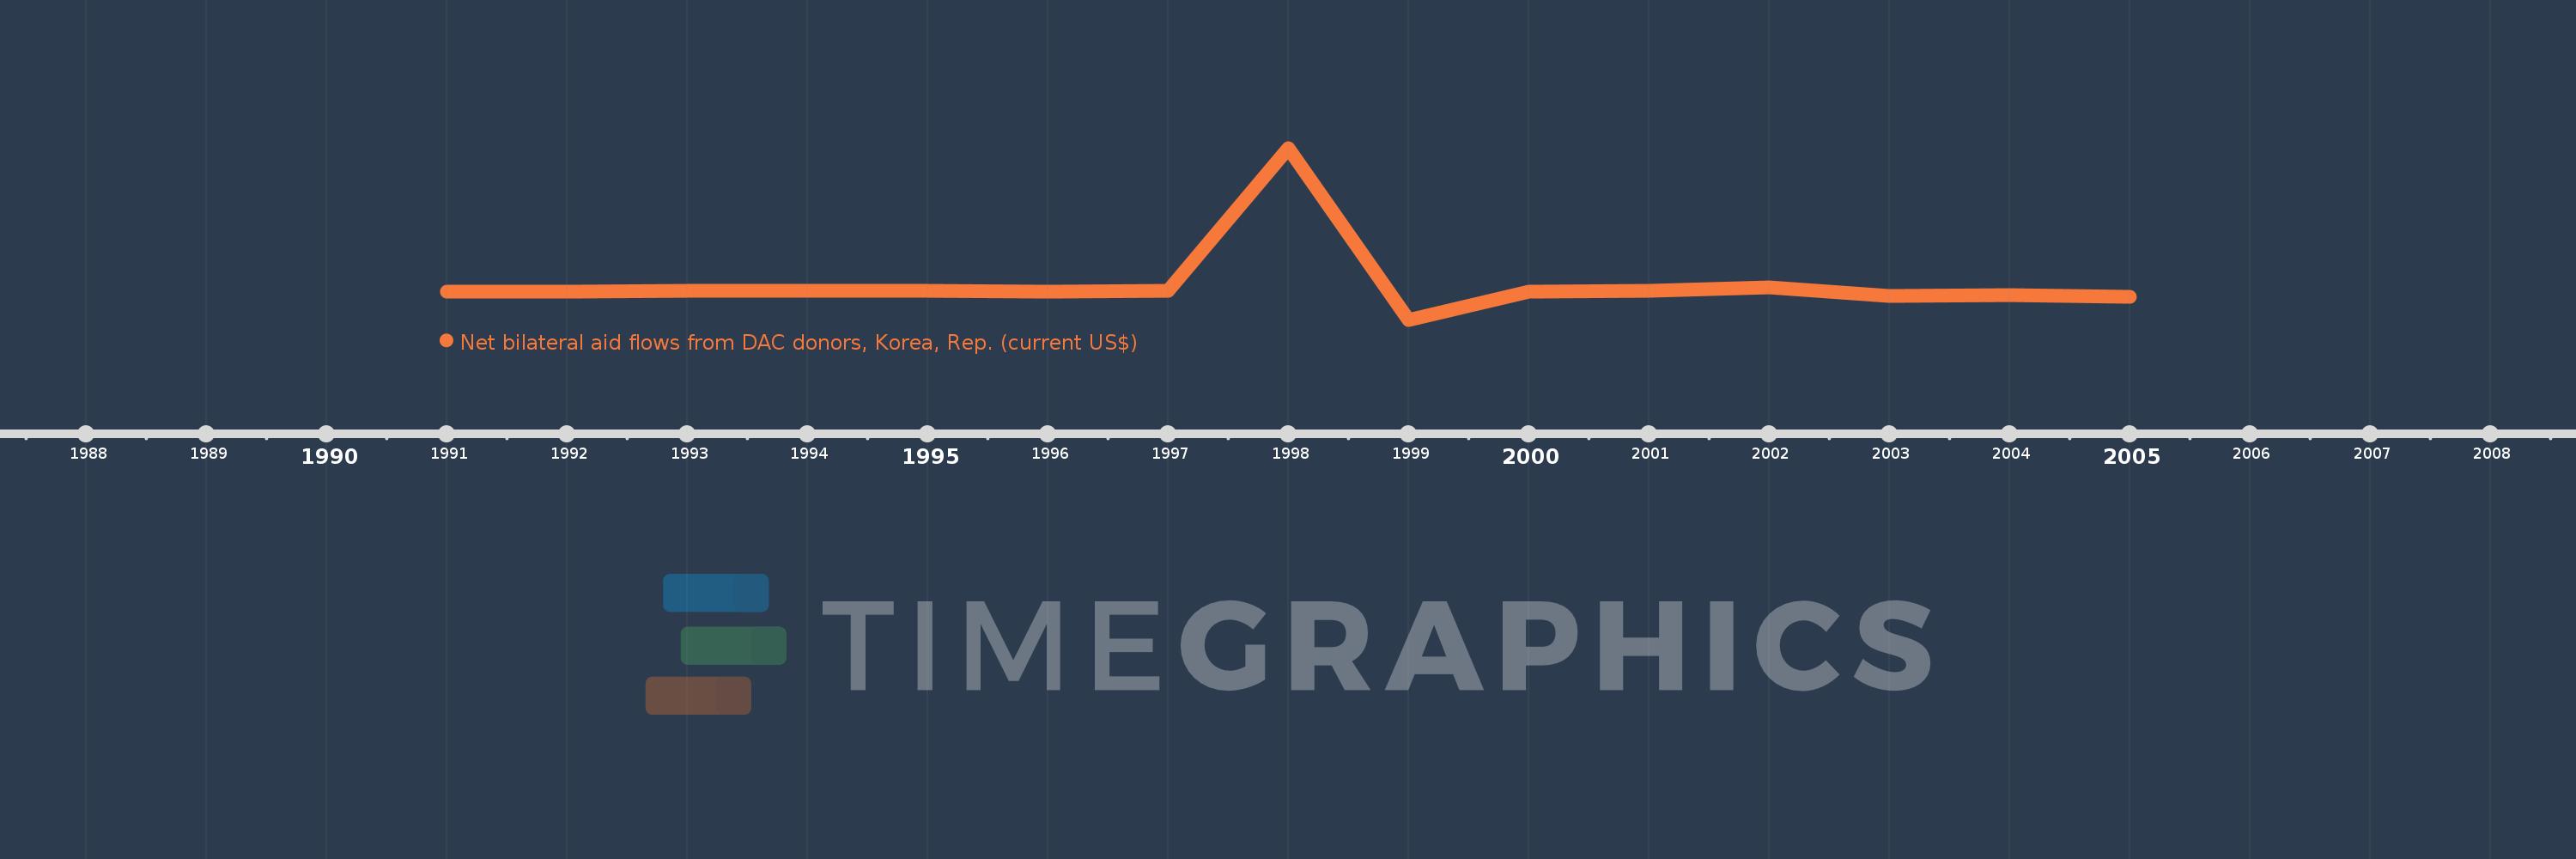
This timeline shows a graph from 1991 to 2005 of Hungary. No data until 1990. Number of actual observations by date: 15.
Source name:
World Development Indicators
Source organization:
Development Assistance Committee of the Organisation for Economic Co-operation and Development, Geographical Distribution of Financial Flows to Developing Countries, Development Co-operation Report, and International Development Statistics database. Data are available online at: www.oecd.org/dac/stats/idsonline.
Categories, topics:
Aid Effectiveness
Last updated:
apr 23, 2017
Indicators value changes by year
Meaning:
630.667K
Minimum:
-2.28 mln
jan 1, 1999
Maximum:
11.81 mln
jan 1, 1998
At the date of observation
Value
Absolute change
Change from the previous value
jan 1, 1991
20.0K
+20.0K
0.0%
jan 1, 1992
30.0K
+10.0K
50.0%
jan 1, 1993
60.0K
+30.0K
100.0%
jan 1, 1994
70.0K
+10.0K
16.67%
jan 1, 1995
100.0K
+30.0K
42.86%
jan 1, 1996
50.0K
-50.0K
-50.0%
jan 1, 1997
70.0K
+20.0K
40.0%
jan 1, 1998
11.81 mln
+11.74 mln
16.77K%
jan 1, 1999
-2.28 mln
-14.09 mln
-119.31%
jan 1, 2000
40.0K
+2.32 mln
-101.75%
jan 1, 2001
120.0K
+80.0K
200.0%
jan 1, 2002
350.0K
+230.0K
191.67%
jan 1, 2003
-300.0K
-650.0K
-185.71%
jan 1, 2004
-280.0K
+20.0K
-6.67%
jan 1, 2005
-400.0K
-120.0K
42.86%
Ranking of countries by current statistics by years