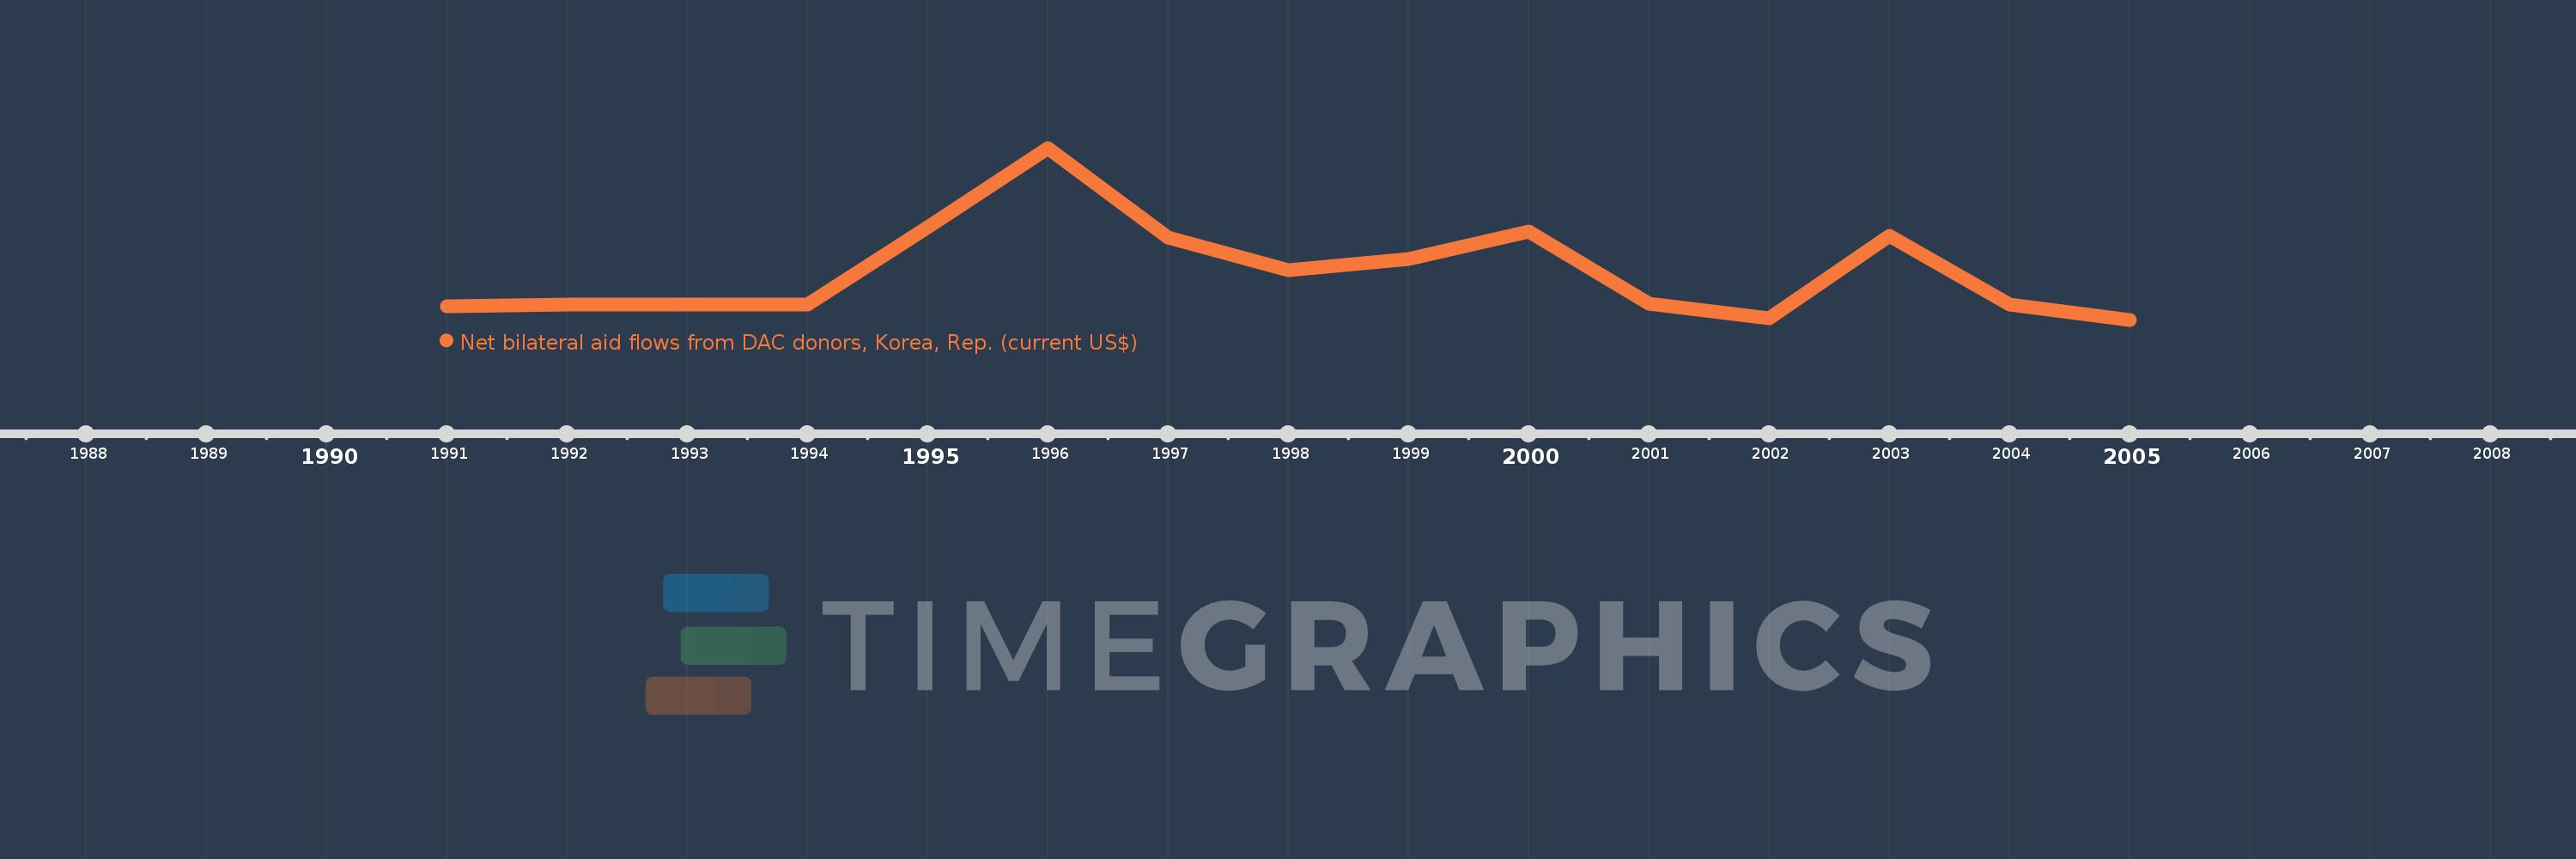
This timeline shows a graph from 1991 to 2005 of Romania. No data until 1990. Number of actual observations by date: 15.
Source name:
World Development Indicators
Source organization:
Development Assistance Committee of the Organisation for Economic Co-operation and Development, Geographical Distribution of Financial Flows to Developing Countries, Development Co-operation Report, and International Development Statistics database. Data are available online at: www.oecd.org/dac/stats/idsonline.
Categories, topics:
Aid Effectiveness
Last updated:
apr 23, 2017
Indicators value changes by year
Meaning:
4.971 mln
Minimum:
-1.95 mln
jan 1, 2005
Maximum:
22.77 mln
jan 1, 1996
At the date of observation
Value
Absolute change
Change from the previous value
jan 1, 1991
20.0K
+20.0K
0.0%
jan 1, 1992
270.0K
+250.0K
1.25K%
jan 1, 1993
230.0K
-40.0K
-14.81%
jan 1, 1994
240.0K
+10.0K
4.35%
jan 1, 1995
11.4 mln
+11.16 mln
4.65K%
jan 1, 1996
22.77 mln
+11.37 mln
99.74%
jan 1, 1997
9.94 mln
-12.83 mln
-56.35%
jan 1, 1998
5.19 mln
-4.75 mln
-47.79%
jan 1, 1999
6.74 mln
+1.55 mln
29.87%
jan 1, 2000
10.73 mln
+3.99 mln
59.2%
jan 1, 2001
360.0K
-10.37 mln
-96.64%
jan 1, 2002
-1.73 mln
-2.09 mln
-580.56%
jan 1, 2003
10.18 mln
+11.91 mln
-688.44%
jan 1, 2004
180.0K
-10.0 mln
-98.23%
jan 1, 2005
-1.95 mln
-2.13 mln
-1.18K%
Ranking of countries by current statistics by years