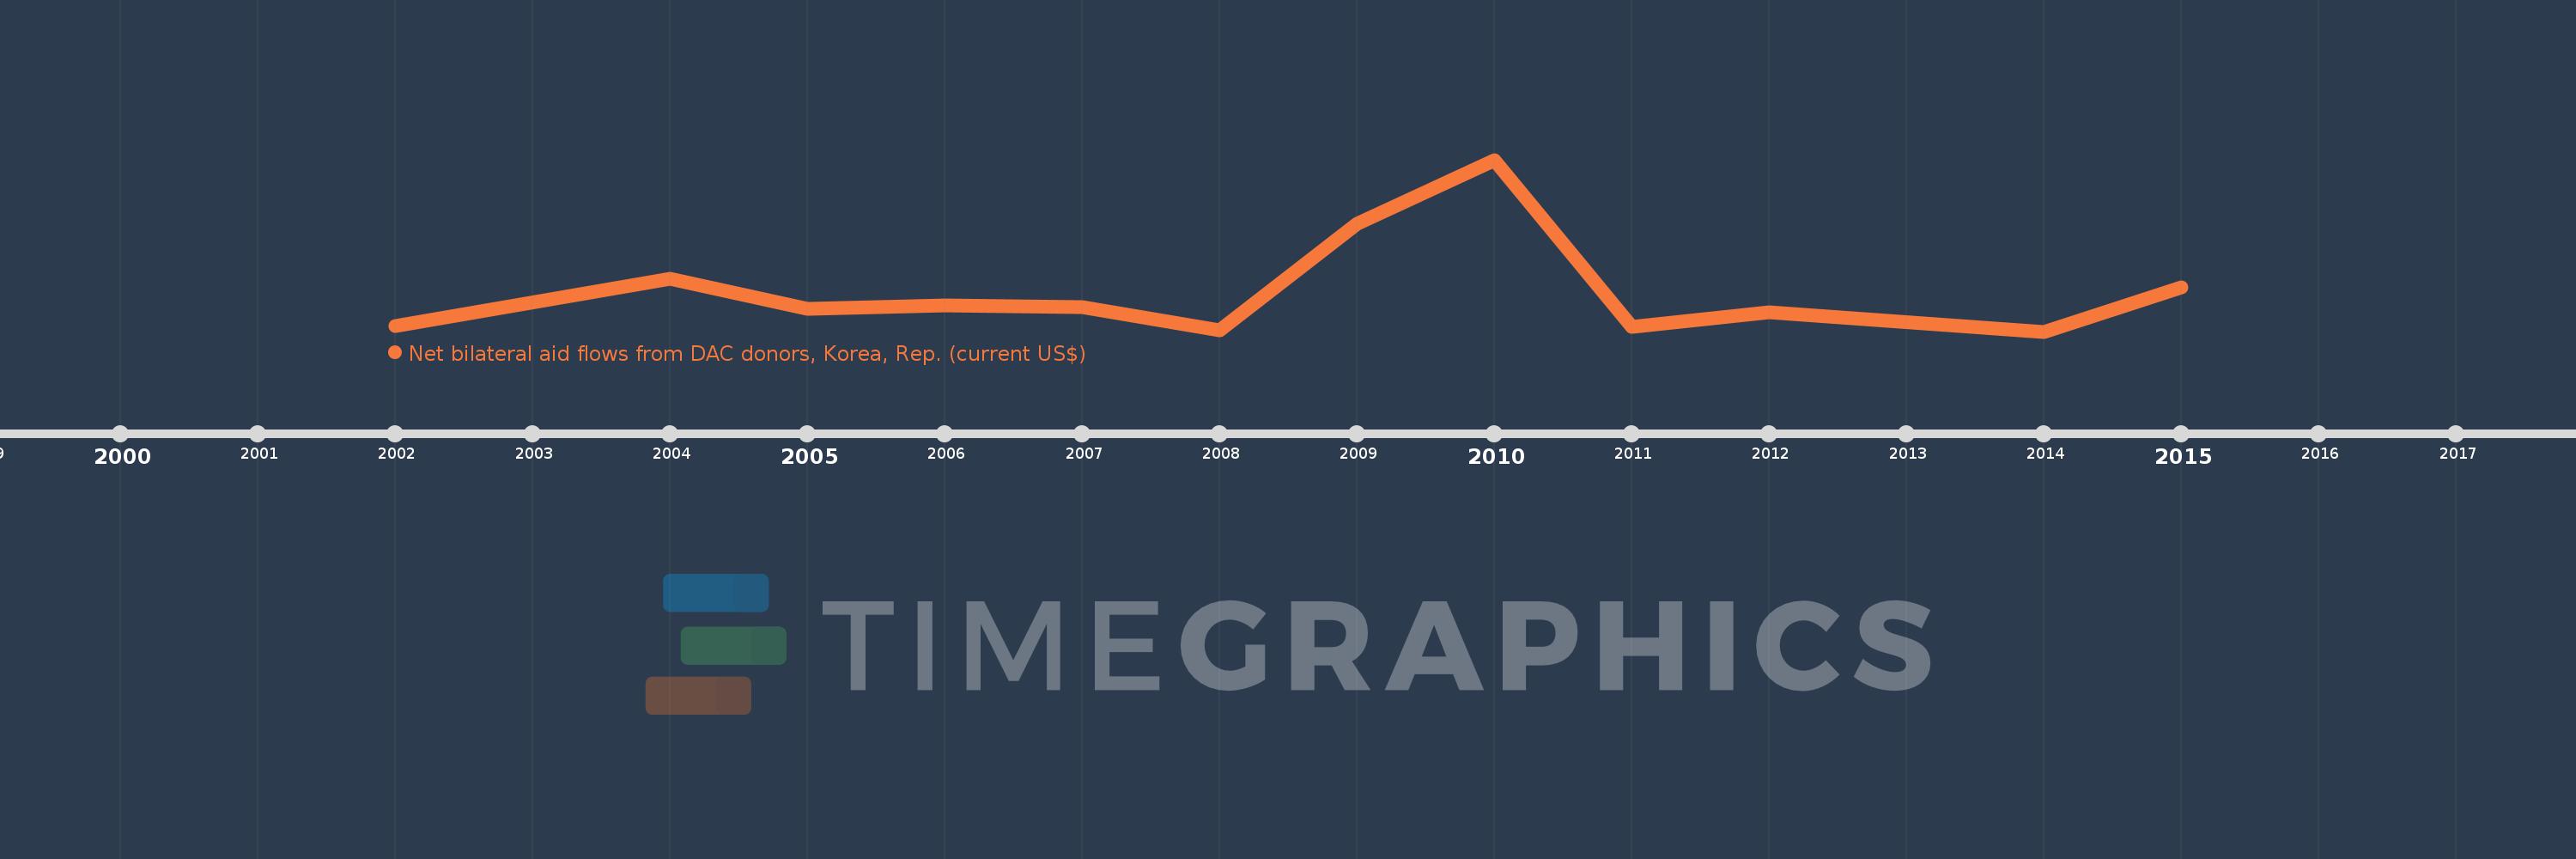
This timeline shows a graph from 2002 to 2015 of Serbia. No data until 2001. Number of actual observations by date: 12.
Source name:
World Development Indicators
Source organization:
Development Assistance Committee of the Organisation for Economic Co-operation and Development, Geographical Distribution of Financial Flows to Developing Countries, Development Co-operation Report, and International Development Statistics database. Data are available online at: www.oecd.org/dac/stats/idsonline.
Categories, topics:
Aid Effectiveness
Last updated:
apr 23, 2017
Indicators value changes by year
Meaning:
390.833K
Minimum:
20.0K
jan 1, 2014
Maximum:
1.61 mln
jan 1, 2010
At the date of observation
Value
Absolute change
Change from the previous value
jan 1, 2002
70.0K
+70.0K
0.0%
jan 1, 2004
510.0K
+440.0K
628.57%
jan 1, 2005
230.0K
-280.0K
-54.9%
jan 1, 2006
260.0K
+30.0K
13.04%
jan 1, 2007
250.0K
-10.0K
-3.85%
jan 1, 2008
30.0K
-220.0K
-88.0%
jan 1, 2009
1.02 mln
+990.0K
3.3K%
jan 1, 2010
1.61 mln
+590.0K
57.84%
jan 1, 2011
60.0K
-1.55 mln
-96.27%
jan 1, 2012
200.0K
+140.0K
233.33%
jan 1, 2014
20.0K
-180.0K
-90.0%
jan 1, 2015
430.0K
+410.0K
2.05K%
Ranking of countries by current statistics by years