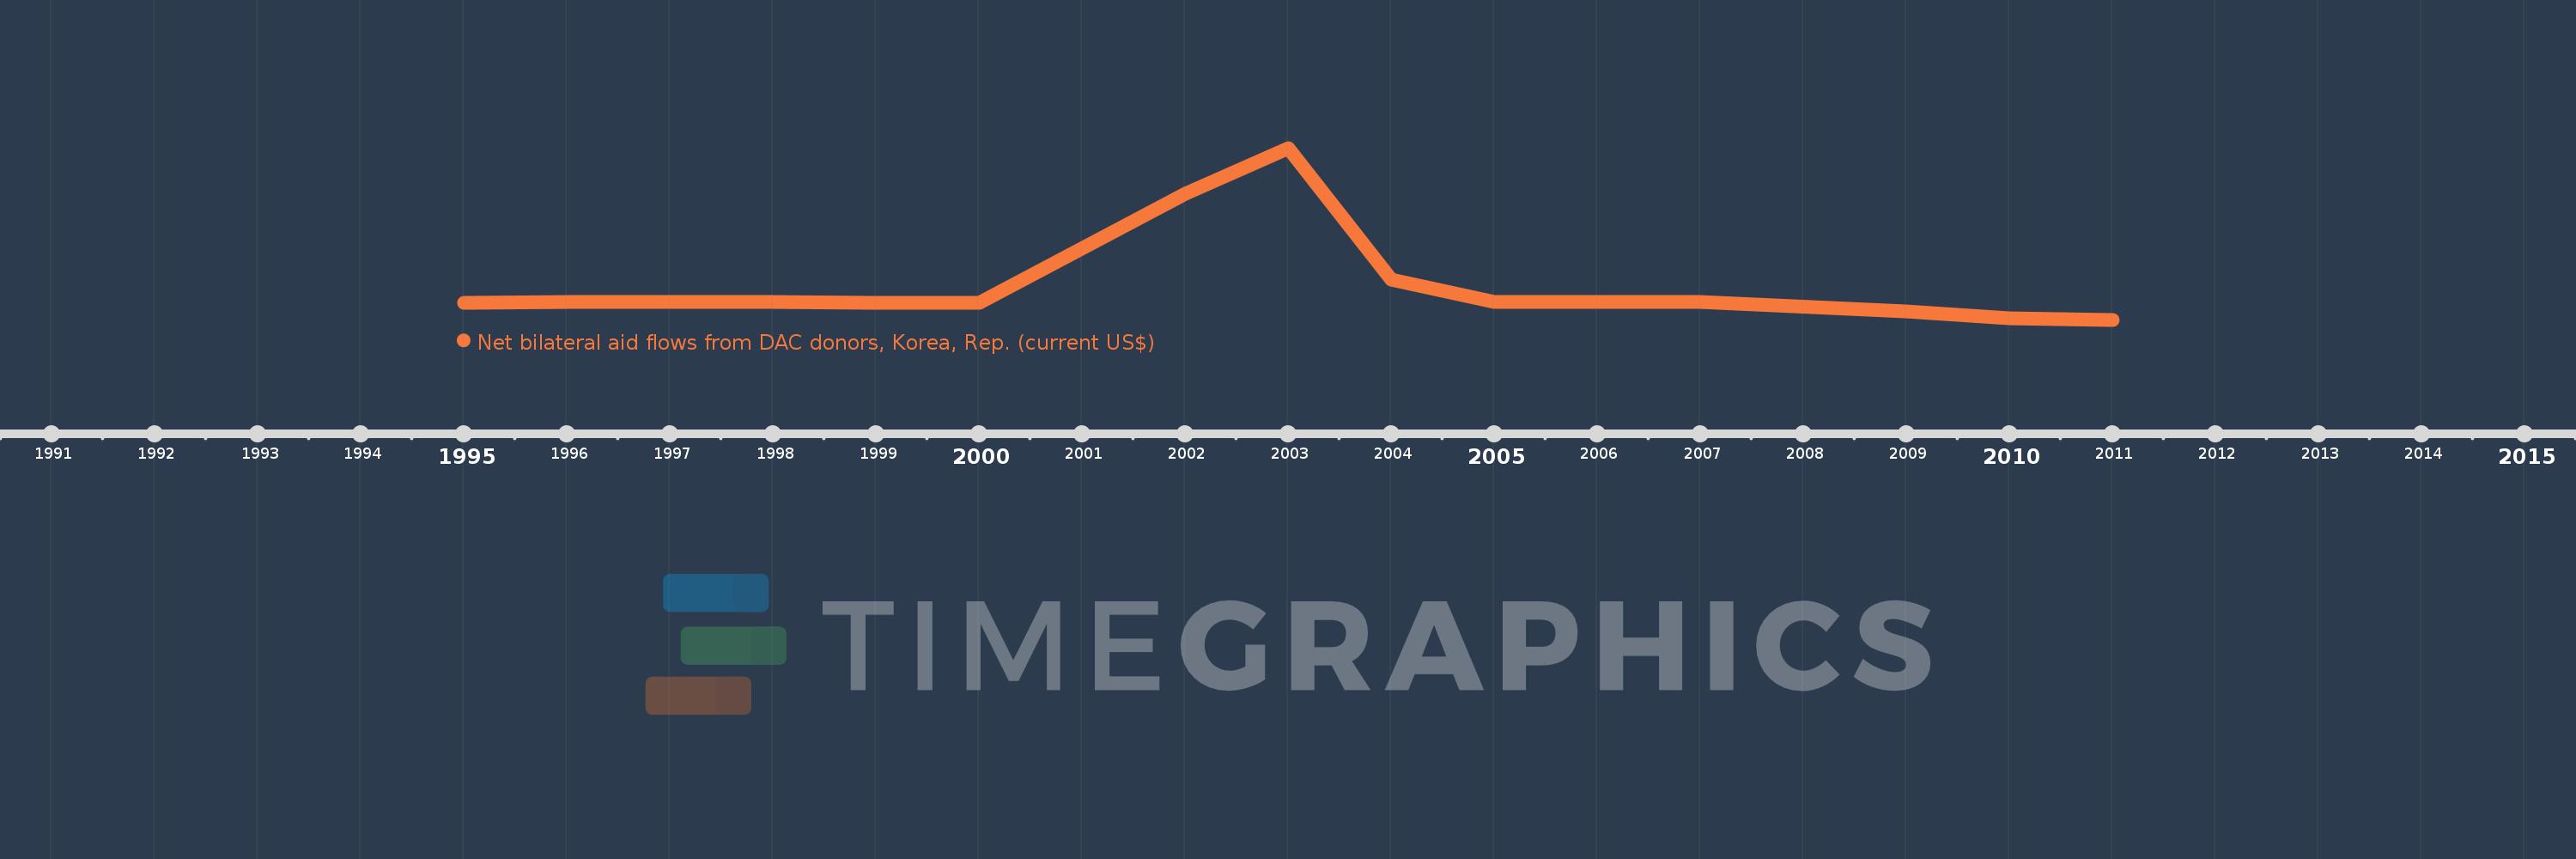
This timeline shows a graph from 1995 to 2011 of Croatia. No data until 1994. Number of actual observations by date: 14.
Source name:
World Development Indicators
Source organization:
Development Assistance Committee of the Organisation for Economic Co-operation and Development, Geographical Distribution of Financial Flows to Developing Countries, Development Co-operation Report, and International Development Statistics database. Data are available online at: www.oecd.org/dac/stats/idsonline.
Categories, topics:
Aid Effectiveness
Last updated:
apr 23, 2017
Indicators value changes by year
Meaning:
2.151 mln
Minimum:
-2.11 mln
jan 1, 2011
Maximum:
18.9 mln
jan 1, 2003
At the date of observation
Value
Absolute change
Change from the previous value
jan 1, 1995
10.0K
+10.0K
0.0%
jan 1, 1996
80.0K
+70.0K
700.0%
jan 1, 1997
20.0K
-60.0K
-75.0%
jan 1, 1998
20.0K
0.0
0.0%
jan 1, 1999
10.0K
-10.0K
-50.0%
jan 1, 2000
10.0K
0.0
0.0%
jan 1, 2002
13.32 mln
+13.31 mln
133.1K%
jan 1, 2003
18.9 mln
+5.58 mln
41.89%
jan 1, 2004
2.83 mln
-16.07 mln
-85.03%
jan 1, 2005
20.0K
-2.81 mln
-99.29%
jan 1, 2007
50.0K
+30.0K
150.0%
jan 1, 2009
-1.11 mln
-1.16 mln
-2.32K%
jan 1, 2010
-1.93 mln
-820.0K
73.87%
jan 1, 2011
-2.11 mln
-180.0K
9.33%
Ranking of countries by current statistics by years