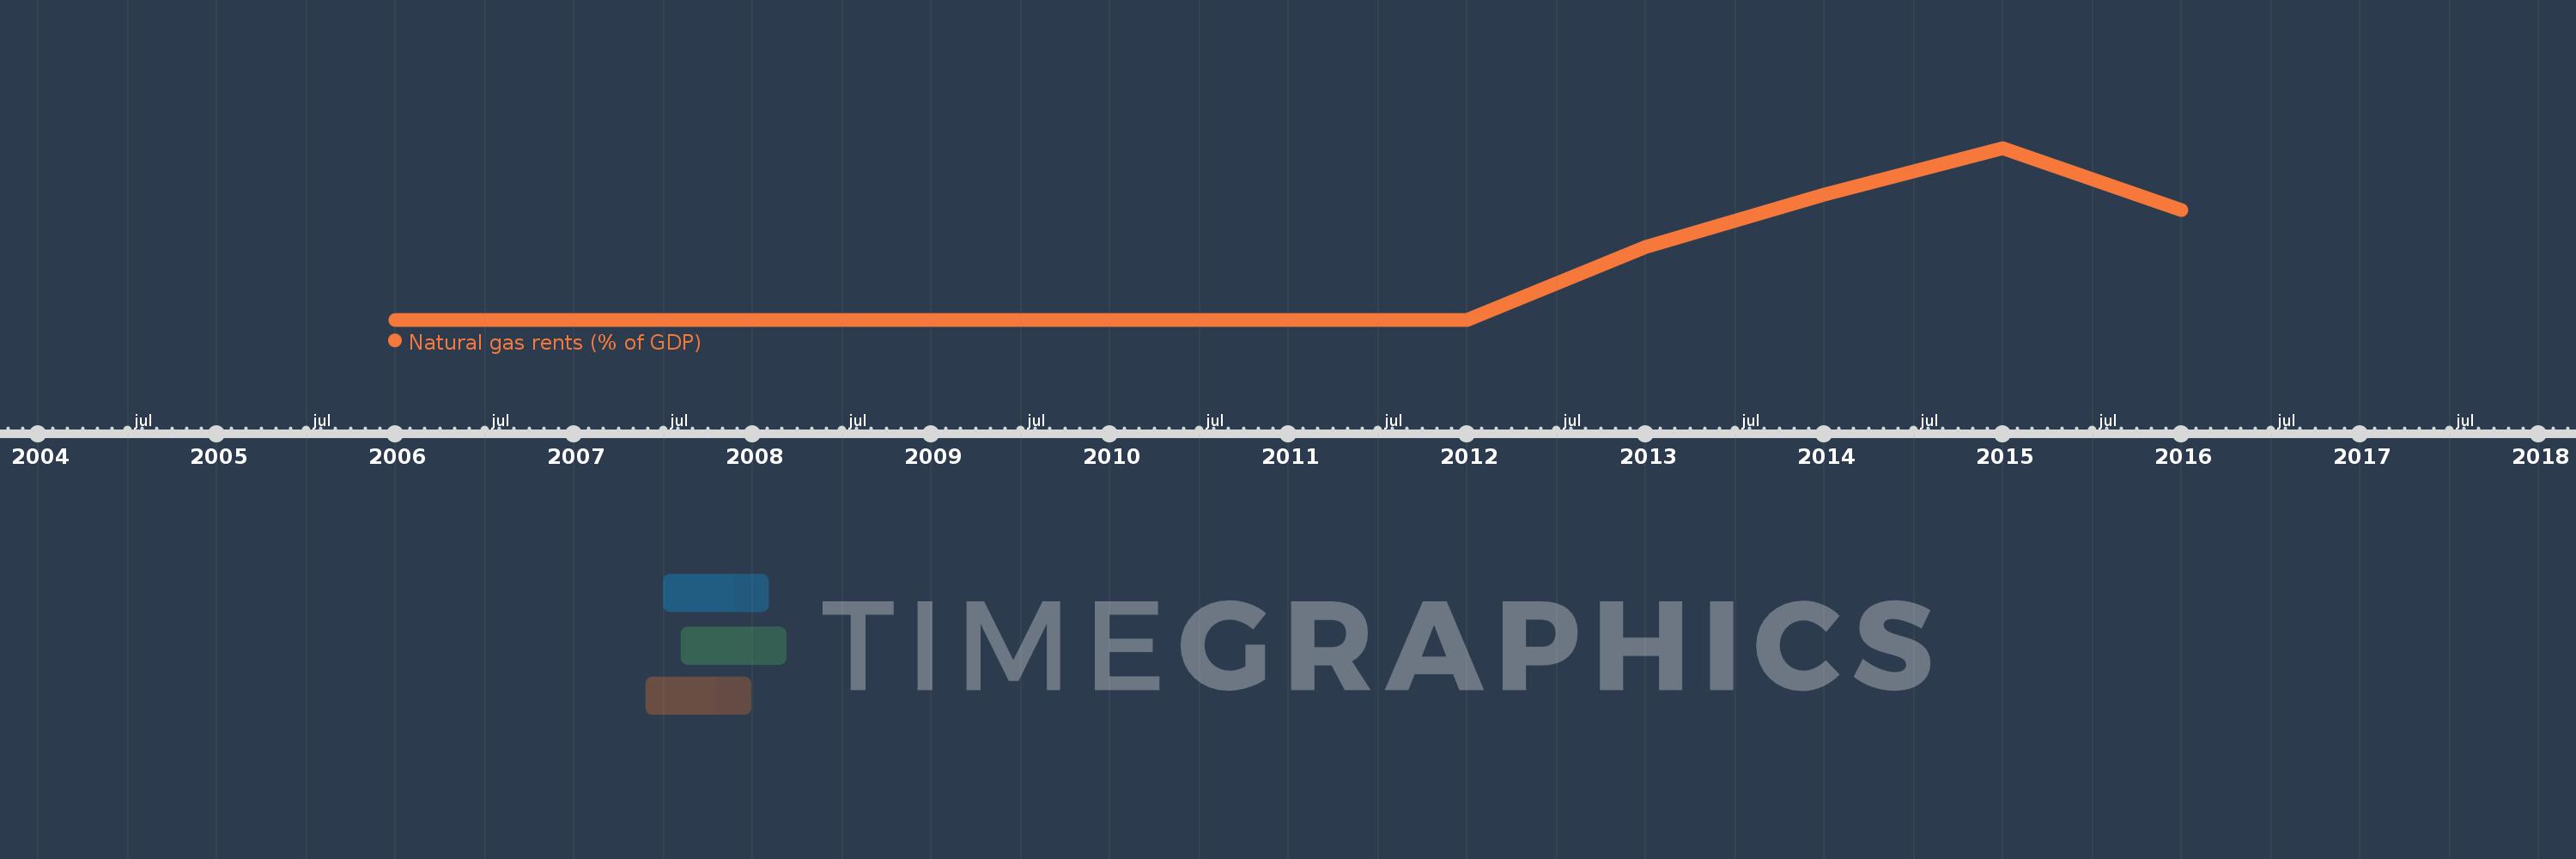
This timeline shows a graph from 2006 to 2016 of Belize. No data until 2005. Number of actual observations by date: 11.
Source name:
World Development Indicators
Source organization:
Estimates based on sources and methods described in "The Changing Wealth of Nations: Measuring Sustainable Development in the New Millennium" (World Bank, 2011).
Categories, topics:
Energy & Mining, Environment
Last updated:
apr 23, 2017
Indicators value changes by year
Meaning:
0.009
Minimum:
0.0
jan 1, 2006
Maximum:
0.033
jan 1, 2015
At the date of observation
Value
Absolute change
Change from the previous value
jan 1, 2006
0.0
+0.0
0.0%
jan 1, 2007
0.0
+0.0
50.84%
jan 1, 2008
0.0
+0.0
31.11%
jan 1, 2009
0.0
+0.0
45.91%
jan 1, 2010
0.0
0.0
-32.9%
jan 1, 2011
0.0
0.0
-15.73%
jan 1, 2012
0.0
+0.0
105.77%
jan 1, 2013
0.014
+0.013
2.81K%
jan 1, 2014
0.024
+0.01
72.0%
jan 1, 2015
0.033
+0.009
36.15%
jan 1, 2016
0.021
-0.011
-34.4%
Ranking of countries by current statistics by years