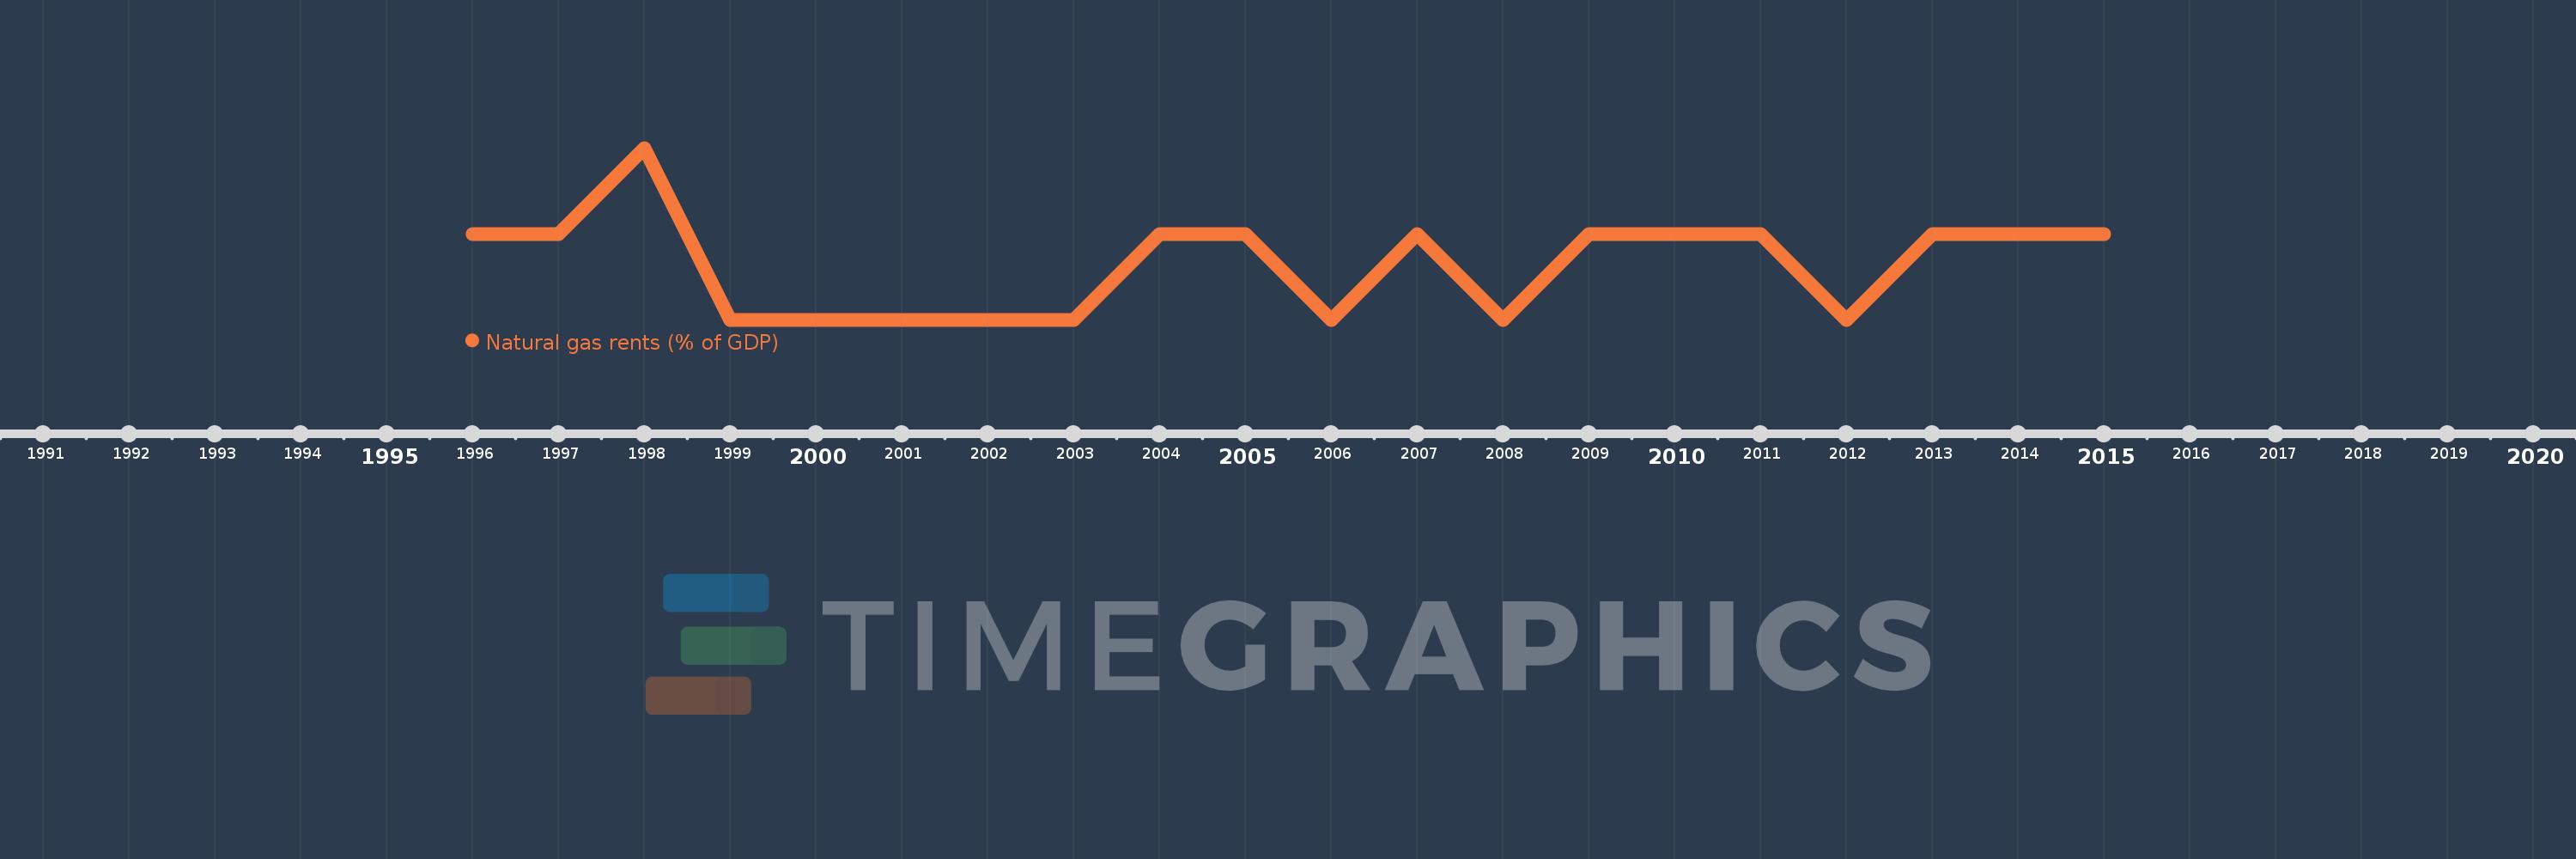
This timeline shows a graph from 1996 to 2015 of Slovenia. No data until 1995. Number of actual observations by date: 20.
Source name:
World Development Indicators
Source organization:
Estimates based on sources and methods described in "The Changing Wealth of Nations: Measuring Sustainable Development in the New Millennium" (World Bank, 2011).
Categories, topics:
Energy & Mining, Environment
Last updated:
apr 23, 2017
Indicators value changes by year
Meaning:
0.001
Minimum:
0.0
jan 1, 2000
Maximum:
0.002
jan 1, 1998
At the date of observation
Value
Absolute change
Change from the previous value
jan 1, 1996
0.001
+0.001
0.0%
jan 1, 1997
0.001
+0.0
16.8%
jan 1, 1998
0.002
+0.0
28.11%
jan 1, 1999
0.0
-0.001
-72.35%
jan 1, 2000
0.0
0.0
-89.53%
jan 1, 2001
0.0
+0.0
233.45%
jan 1, 2002
0.0
+0.0
69.86%
jan 1, 2003
0.0
0.0
-32.77%
jan 1, 2004
0.001
+0.001
361.23%
jan 1, 2005
0.001
0.0
-22.94%
jan 1, 2006
0.0
0.0
-35.15%
jan 1, 2007
0.001
+0.0
35.71%
jan 1, 2008
0.0
0.0
-19.59%
jan 1, 2009
0.001
+0.0
27.28%
jan 1, 2010
0.001
0.0
-1.99%
jan 1, 2011
0.001
0.0
-1.53%
jan 1, 2012
0.0
0.0
-36.92%
jan 1, 2013
0.001
+0.0
64.91%
jan 1, 2014
0.001
+0.0
25.39%
jan 1, 2015
0.001
0.0
-5.85%
Ranking of countries by current statistics by years