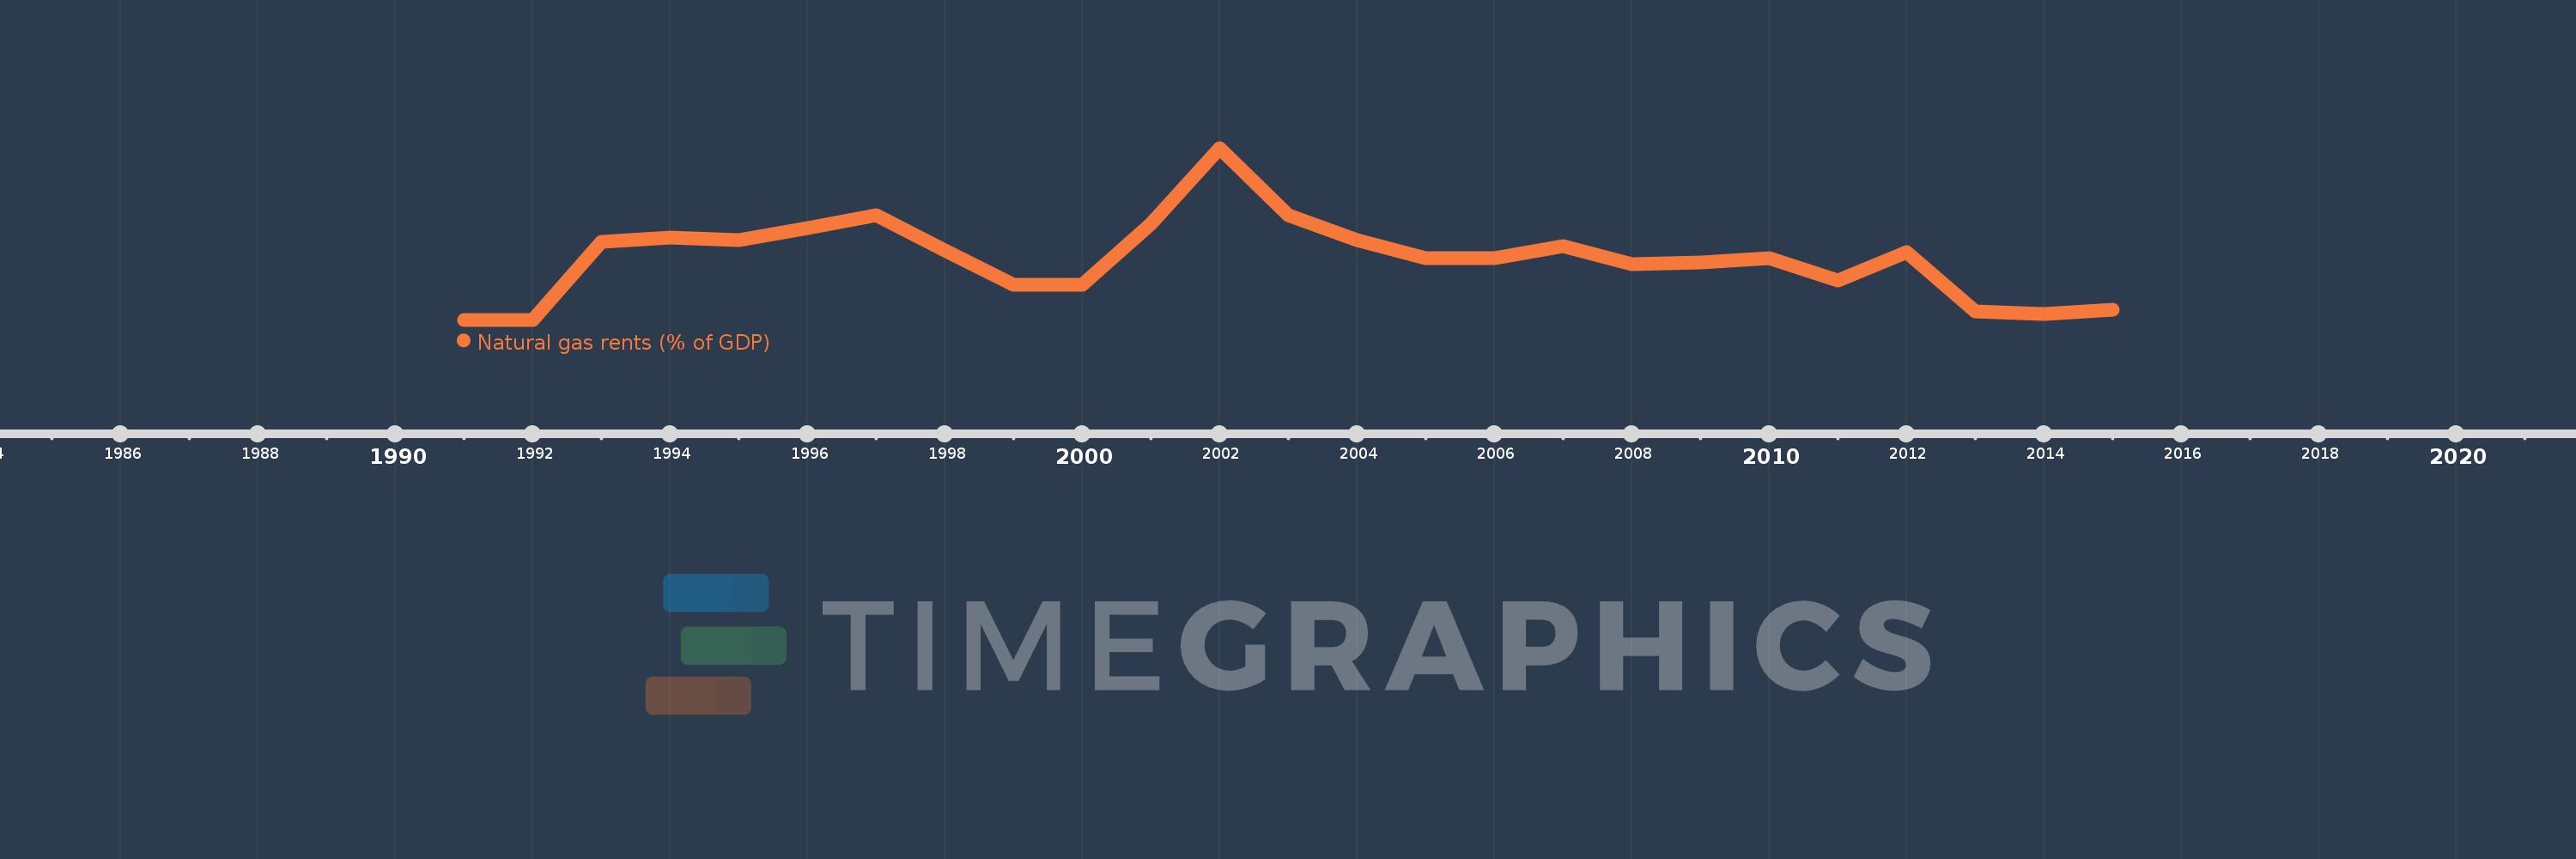
This timeline shows a graph from 1991 to 2015 of Belarus. No data until 1990. Number of actual observations by date: 25.
Source name:
World Development Indicators
Source organization:
Estimates based on sources and methods described in "The Changing Wealth of Nations: Measuring Sustainable Development in the New Millennium" (World Bank, 2011).
Categories, topics:
Energy & Mining, Environment
Last updated:
apr 23, 2017
Indicators value changes by year
Meaning:
0.03
Minimum:
0.0
jan 1, 1991
Maximum:
0.084
jan 1, 2002
At the date of observation
Value
Absolute change
Change from the previous value
jan 1, 1991
0.0
0.0
0.0%
jan 1, 1992
0.0
0.0
%
jan 1, 1993
0.038
+0.038
%
jan 1, 1994
0.04
+0.003
7.06%
jan 1, 1995
0.039
-0.002
-3.76%
jan 1, 1996
0.045
+0.007
16.72%
jan 1, 1997
0.051
+0.005
11.67%
jan 1, 1998
0.034
-0.017
-33.26%
jan 1, 1999
0.017
-0.017
-49.89%
jan 1, 2000
0.017
+0.0
0.65%
jan 1, 2001
0.047
+0.029
172.61%
jan 1, 2002
0.084
+0.037
80.19%
jan 1, 2003
0.051
-0.033
-39.38%
jan 1, 2004
0.039
-0.012
-22.89%
jan 1, 2005
0.03
-0.009
-22.64%
jan 1, 2006
0.03
0.0
-0.16%
jan 1, 2007
0.036
+0.006
18.83%
jan 1, 2008
0.027
-0.009
-24.2%
jan 1, 2009
0.028
+0.001
3.82%
jan 1, 2010
0.03
+0.002
7.34%
jan 1, 2011
0.019
-0.012
-38.29%
jan 1, 2012
0.033
+0.014
76.38%
jan 1, 2013
0.004
-0.03
-89.26%
jan 1, 2014
0.003
0.0
-7.3%
jan 1, 2015
0.005
+0.002
47.6%
Ranking of countries by current statistics by years