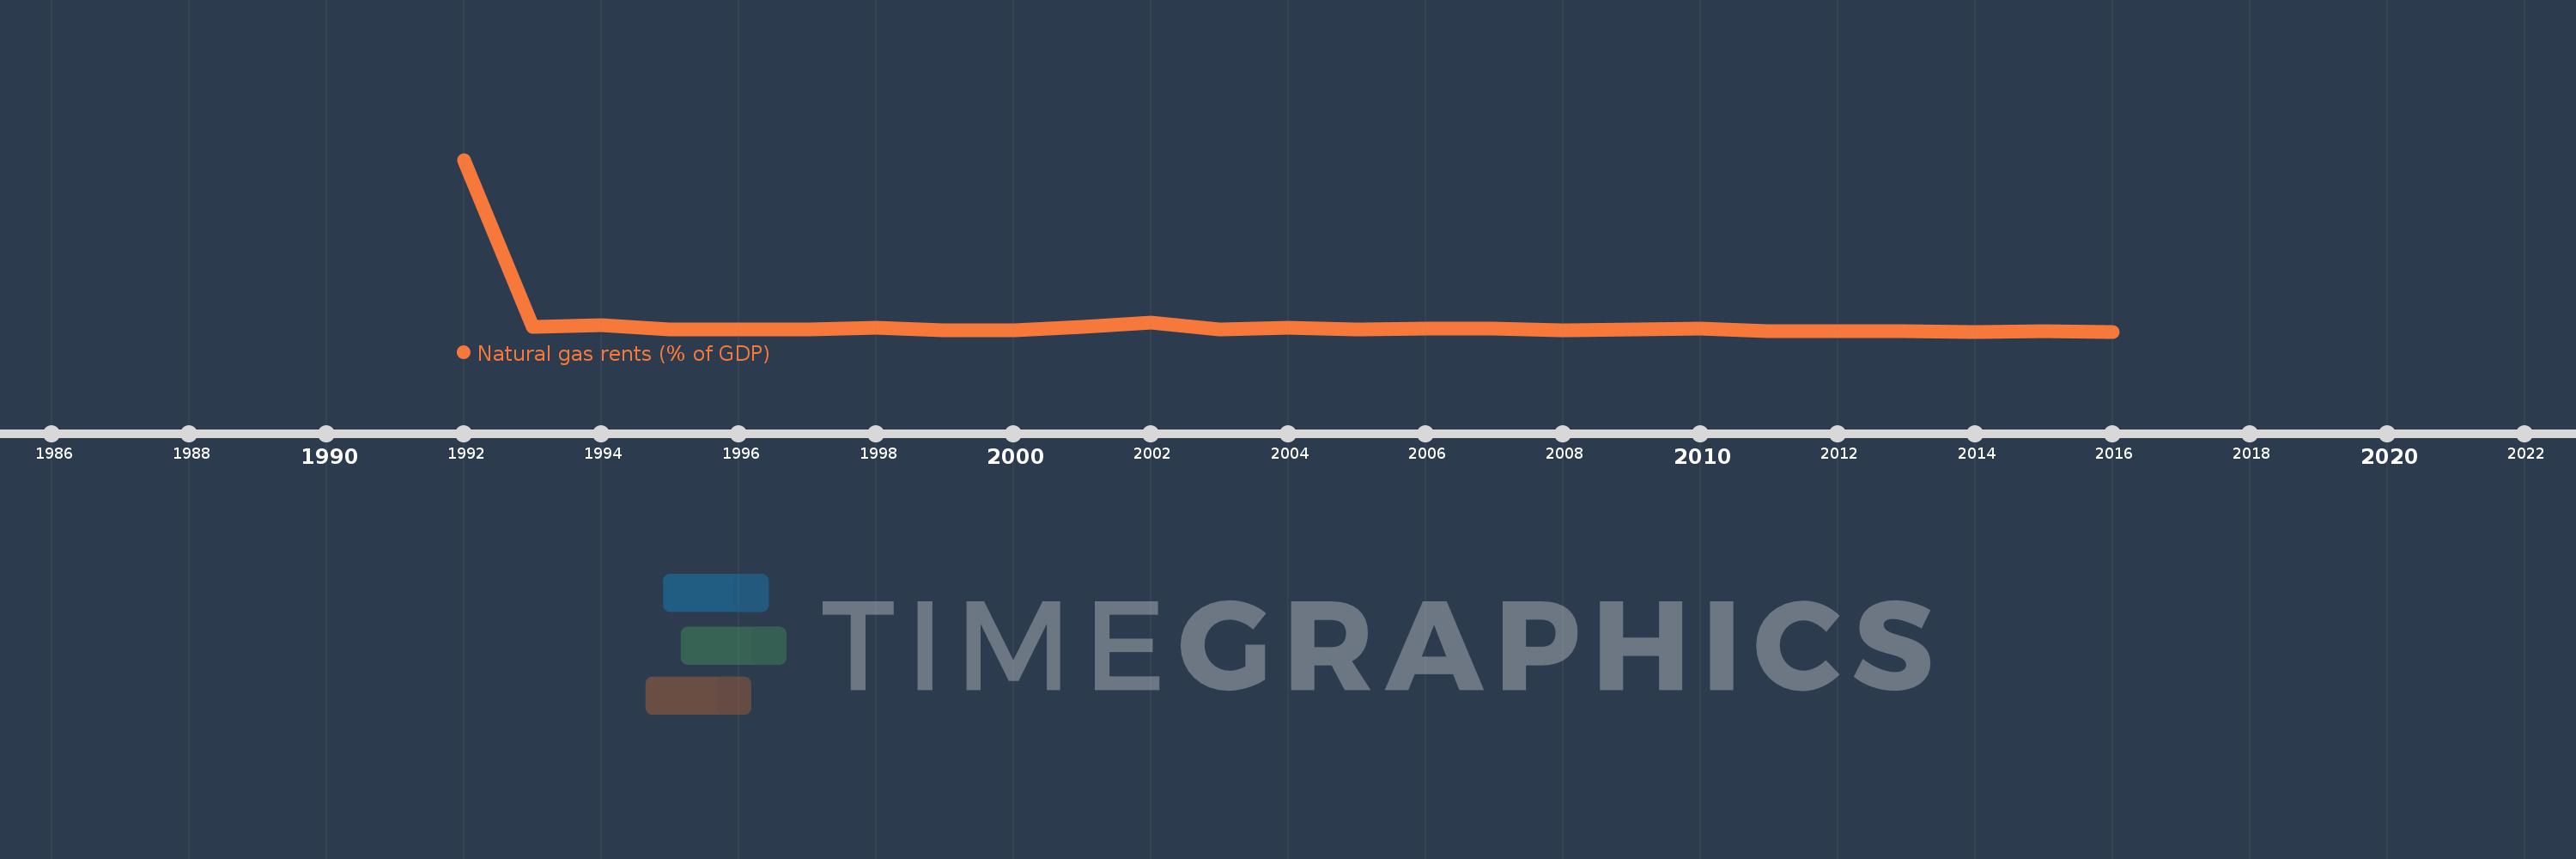
This timeline shows a graph from 1992 to 2016 of Tajikistan. No data until 1991. Number of actual observations by date: 25.
Source name:
World Development Indicators
Source organization:
Estimates based on sources and methods described in "The Changing Wealth of Nations: Measuring Sustainable Development in the New Millennium" (World Bank, 2011).
Categories, topics:
Energy & Mining, Environment
Last updated:
apr 23, 2017
Indicators value changes by year
Meaning:
0.212
Minimum:
0.017
jan 1, 2014
Maximum:
3.622
jan 1, 1992
At the date of observation
Value
Absolute change
Change from the previous value
jan 1, 1992
3.622
+3.622
0.0%
jan 1, 1993
0.114
-3.508
-96.86%
jan 1, 1994
0.152
+0.039
33.93%
jan 1, 1995
0.055
-0.097
-63.89%
jan 1, 1996
0.07
+0.015
27.7%
jan 1, 1997
0.07
+0.0
0.03%
jan 1, 1998
0.092
+0.022
30.83%
jan 1, 1999
0.047
-0.045
-48.46%
jan 1, 2000
0.049
+0.001
2.69%
jan 1, 2001
0.122
+0.074
151.68%
jan 1, 2002
0.212
+0.09
73.52%
jan 1, 2003
0.057
-0.155
-73.13%
jan 1, 2004
0.099
+0.042
73.98%
jan 1, 2005
0.065
-0.034
-34.53%
jan 1, 2006
0.083
+0.018
27.85%
jan 1, 2007
0.089
+0.006
6.79%
jan 1, 2008
0.037
-0.052
-58.65%
jan 1, 2009
0.059
+0.022
59.39%
jan 1, 2010
0.075
+0.016
28.16%
jan 1, 2011
0.03
-0.045
-59.45%
jan 1, 2012
0.023
-0.007
-23.52%
jan 1, 2013
0.024
+0.001
2.37%
jan 1, 2014
0.017
-0.007
-29.03%
jan 1, 2015
0.023
+0.006
36.53%
jan 1, 2016
0.017
-0.006
-25.3%
Ranking of countries by current statistics by years