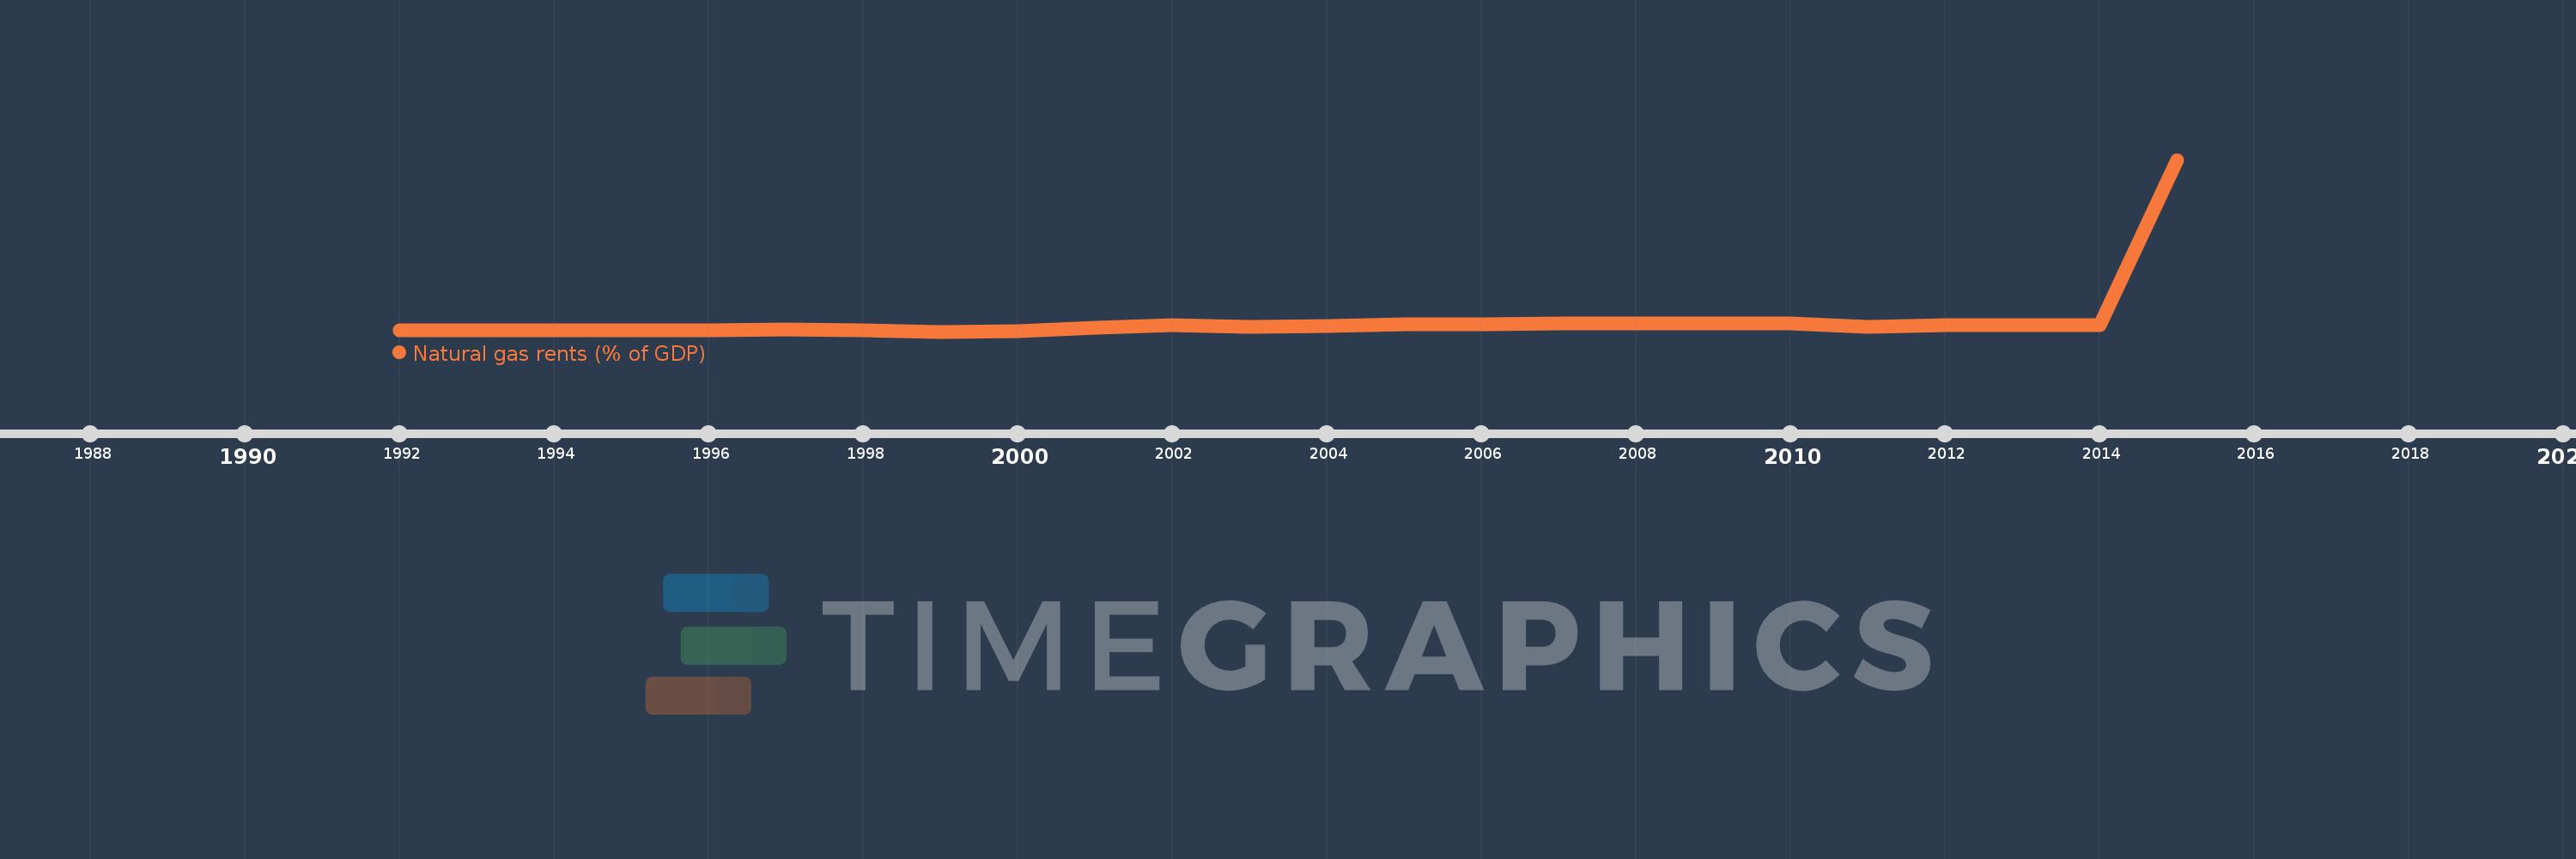
This timeline shows a graph from 1992 to 2015 of Papua New Guinea. No data until 1991. Number of actual observations by date: 24.
Source name:
World Development Indicators
Source organization:
Estimates based on sources and methods described in "The Changing Wealth of Nations: Measuring Sustainable Development in the New Millennium" (World Bank, 2011).
Categories, topics:
Energy & Mining, Environment
Last updated:
apr 23, 2017
Indicators value changes by year
Meaning:
0.105
Minimum:
0.003
jan 1, 1999
Maximum:
1.533
jan 1, 2015
At the date of observation
Value
Absolute change
Change from the previous value
jan 1, 1992
0.015
+0.015
0.0%
jan 1, 1993
0.011
-0.004
-26.81%
jan 1, 1994
0.015
+0.004
39.51%
jan 1, 1995
0.018
+0.003
17.57%
jan 1, 1996
0.017
0.0
-2.76%
jan 1, 1997
0.02
+0.003
17.5%
jan 1, 1998
0.017
-0.003
-14.34%
jan 1, 1999
0.003
-0.014
-80.91%
jan 1, 2000
0.008
+0.005
140.77%
jan 1, 2001
0.041
+0.034
425.6%
jan 1, 2002
0.058
+0.016
39.6%
jan 1, 2003
0.043
-0.015
-25.59%
jan 1, 2004
0.055
+0.012
28.54%
jan 1, 2005
0.071
+0.015
27.65%
jan 1, 2006
0.067
-0.004
-5.39%
jan 1, 2007
0.073
+0.006
9.55%
jan 1, 2008
0.073
0.0
-0.68%
jan 1, 2009
0.078
+0.005
7.49%
jan 1, 2010
0.079
+0.0
0.53%
jan 1, 2011
0.044
-0.035
-44.32%
jan 1, 2012
0.064
+0.02
45.74%
jan 1, 2013
0.064
+0.0
0.7%
jan 1, 2014
0.059
-0.006
-8.83%
jan 1, 2015
1.533
+1.475
2.52K%
Ranking of countries by current statistics by years