29
/
en
AIzaSyAYiBZKx7MnpbEhh9jyipgxe19OcubqV5w
April 1, 2024
63778
Afghanistan
AFG
true
2
1
Natural gas rents (% of GDP)
2016,2015,2014,2013,2012,2011,2010,2009,2008,2007,2006,2005,2004,2003,2002,1982,1981,1980,1979,1978,1977,1976,1975,1974,1973,1972,1971
Download
Global statistics library →Afghanistan →

Natural gas rents (% of GDP)

This statistics in other country:
AfghanistanAlbaniaAlgeriaAngolaArab WorldArgentinaArmeniaAustraliaAustriaAzerbaijanBahrainBangladeshBarbadosBelarusBelgiumBelizeBeninBoliviaBosnia and HerzegovinaBotswanaBrazilBrunei DarussalamBulgariaCambodiaCameroonCanadaCaribbean small statesCentral Europe and the BalticsChadChileChinaColombiaCongo, Dem. Rep.Congo, Rep.Costa RicaCote d'IvoireCroatiaCubaCyprusCzech RepublicDenmarkDominican RepublicEarly-demographic dividendEast Asia & PacificEast Asia & Pacific (excluding high income)East Asia & Pacific (IDA & IBRD countries)EcuadorEgypt, Arab Rep.El SalvadorEquatorial GuineaEritreaEstoniaEthiopiaEuro areaEurope & Central AsiaEurope & Central Asia (excluding high income)Europe & Central Asia (IDA & IBRD countries)European UnionFinlandFragile and conflict affected situationsFranceGabonGeorgiaGermanyGhanaGreeceGuatemalaHaitiHeavily indebted poor countries (HIPC)High incomeHondurasHungaryIBRD onlyIcelandIDA & IBRD totalIDA blendIDA onlyIDA totalIndiaIndonesiaIran, Islamic Rep.IraqIrelandIsraelItalyJamaicaJapanJordanKazakhstanKenyaKorea, Rep.KosovoKuwaitKyrgyz RepublicLate-demographic dividendLatin America & Caribbean Latin America & Caribbean (excluding high income)Latin America & the Caribbean (IDA & IBRD countries)LatviaLeast developed countries: UN classificationLebanonLibyaLithuaniaLow & middle incomeLow incomeLower middle incomeLuxembourgMacedonia, FYRMalaysiaMaltaMauritiusMexicoMiddle East & North AfricaMiddle East & North Africa (excluding high income)Middle East & North Africa (IDA & IBRD countries)Middle incomeMoldovaMongoliaMontenegroMoroccoMozambiqueMyanmarNamibiaNepalNetherlandsNew ZealandNicaraguaNigerNigeriaNorth AmericaNorwayOECD membersOmanOther small statesPakistanPanamaPapua New GuineaParaguayPeruPhilippinesPolandPortugalPost-demographic dividendPre-demographic dividendQatarRomaniaRussian FederationSaudi ArabiaSenegalSerbiaSingaporeSlovak RepublicSloveniaSmall statesSouth AfricaSouth AsiaSouth Asia (IDA & IBRD)South SudanSpainSri LankaSub-Saharan Africa Sub-Saharan Africa (excluding high income)Sub-Saharan Africa (IDA & IBRD countries)SudanSwedenSwitzerlandSyrian Arab RepublicTajikistanTanzaniaThailandTimor-LesteTogoTrinidad and TobagoTunisiaTurkeyTurkmenistanUkraineUnited Arab EmiratesUnited KingdomUnited StatesUpper middle incomeUruguayUzbekistanVenezuela, RBVietnamWest Bank and GazaWorldYemen, Rep.ZambiaZimbabwe
Timeline:
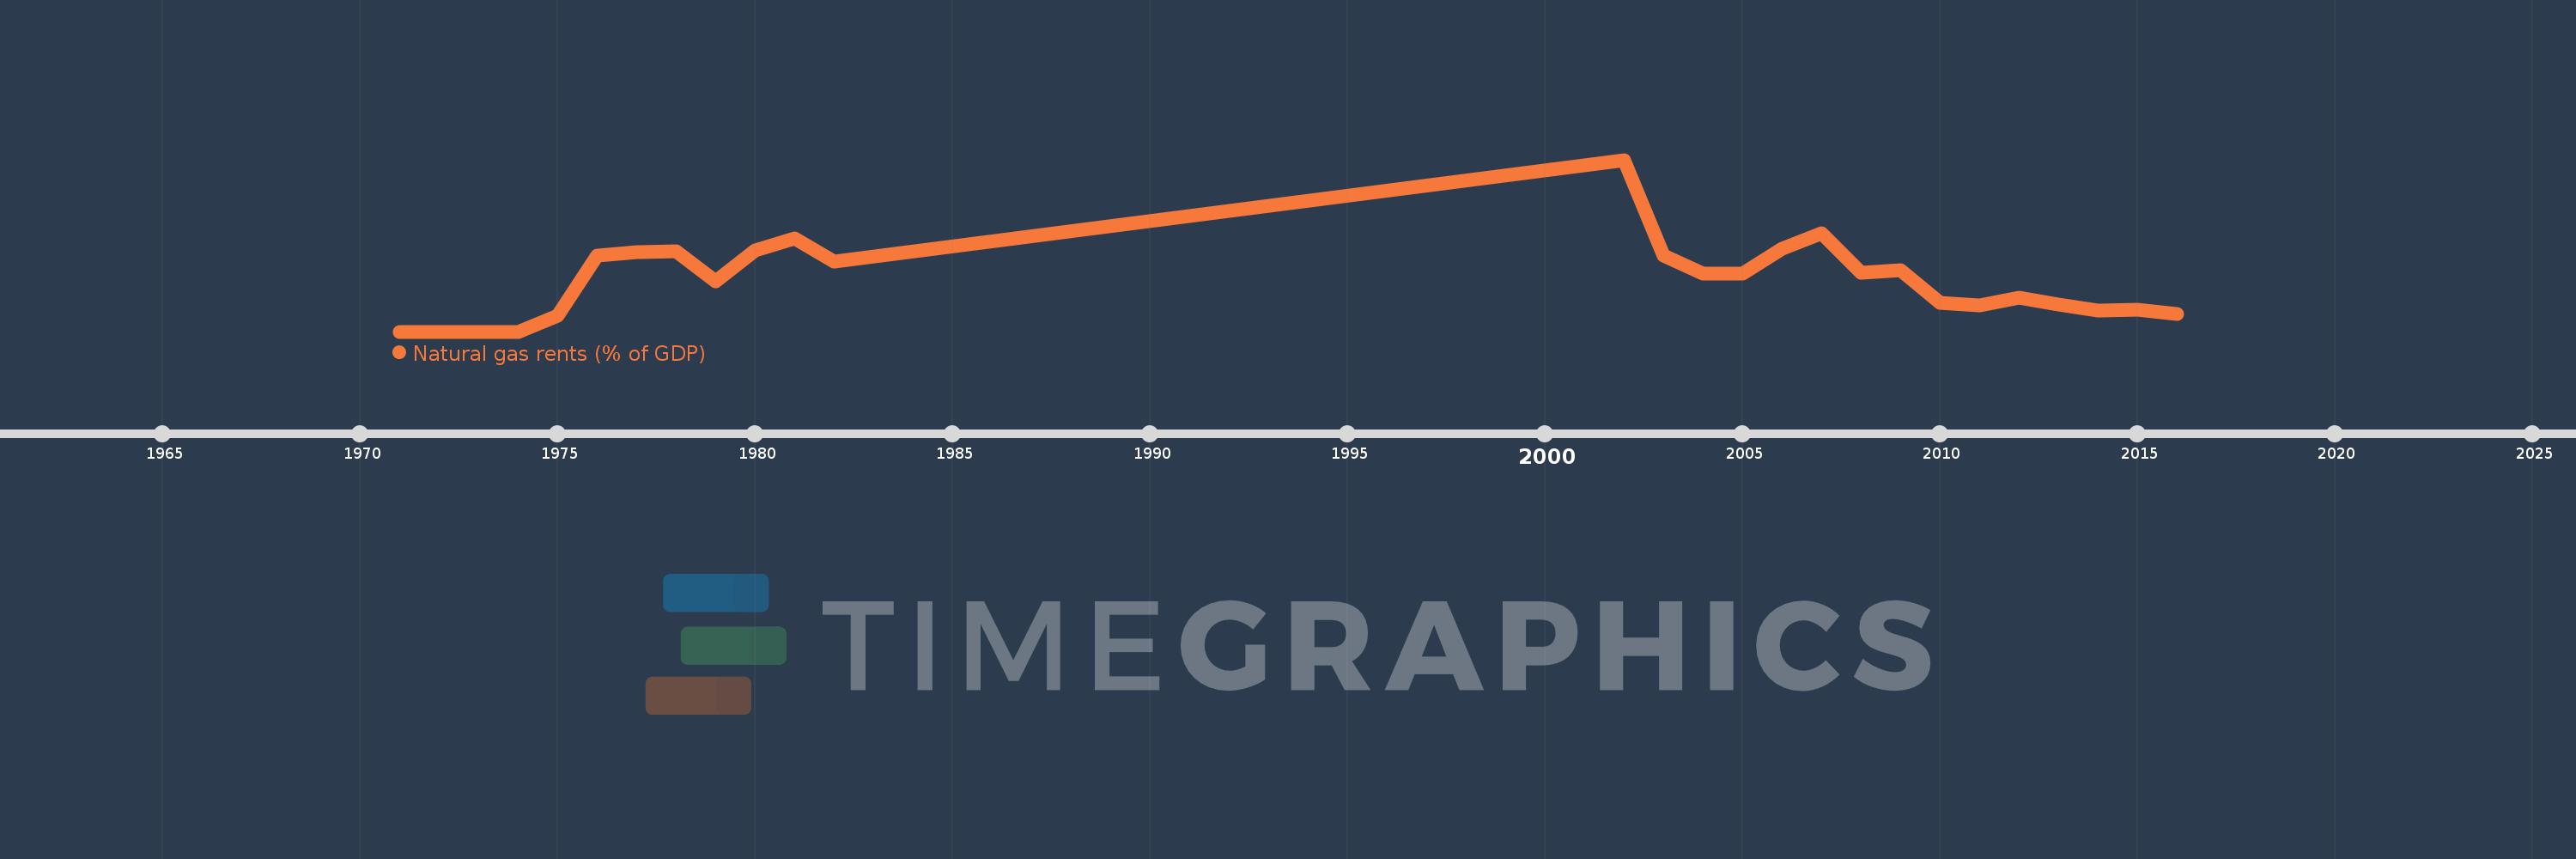
This timeline shows a graph from 1971 to 2016 of Afghanistan. No data until 1970. Number of actual observations by date: 27.
Source name:
World Development Indicators
Source organization:
Estimates based on sources and methods described in "The Changing Wealth of Nations: Measuring Sustainable Development in the New Millennium" (World Bank, 2011).
Categories, topics:
Energy & Mining, Environment
Last updated:
apr 23, 2017
Indicators value changes by year
Mean:
0.35
Minimum:
0.0
jan 1, 1971
Maximum:
1.169
jan 1, 2002
At the date of observation
Value
Absolute change
Change from previous value
jan 1, 1971
0.0
0.0
0.0%
jan 1, 1972
0.0
0.0
%
jan 1, 1973
0.0
0.0
%
jan 1, 1974
0.0
0.0
%
jan 1, 1975
0.111
+0.111
%
jan 1, 1976
0.516
+0.405
366.4%
jan 1, 1977
0.54
+0.024
4.7%
jan 1, 1978
0.545
+0.005
0.95%
jan 1, 1979
0.342
-0.204
-37.33%
jan 1, 1980
0.554
+0.212
62.03%
jan 1, 1981
0.632
+0.078
14.12%
jan 1, 1982
0.477
-0.155
-24.54%
jan 1, 2002
1.169
+0.692
145.03%
jan 1, 2003
0.518
-0.65
-55.66%
jan 1, 2004
0.394
-0.124
-24.01%
jan 1, 2005
0.396
+0.002
0.54%
jan 1, 2006
0.563
+0.167
42.11%
jan 1, 2007
0.667
+0.104
18.49%
jan 1, 2008
0.403
-0.263
-39.52%
jan 1, 2009
0.418
+0.014
3.56%
jan 1, 2010
0.195
-0.222
-53.19%
jan 1, 2011
0.178
-0.018
-9.14%
jan 1, 2012
0.231
+0.053
29.94%
jan 1, 2013
0.182
-0.049
-21.25%
jan 1, 2014
0.146
-0.036
-19.6%
jan 1, 2015
0.147
+0.001
0.93%
jan 1, 2016
0.118
-0.029
-19.97%
Ranking of countries by current statistics by years

Comments:

Send
PremiumAbout & FeedbackTermsPrivacy
logo
© 2022 Selected Technologies LLC – Morgan Hill, California