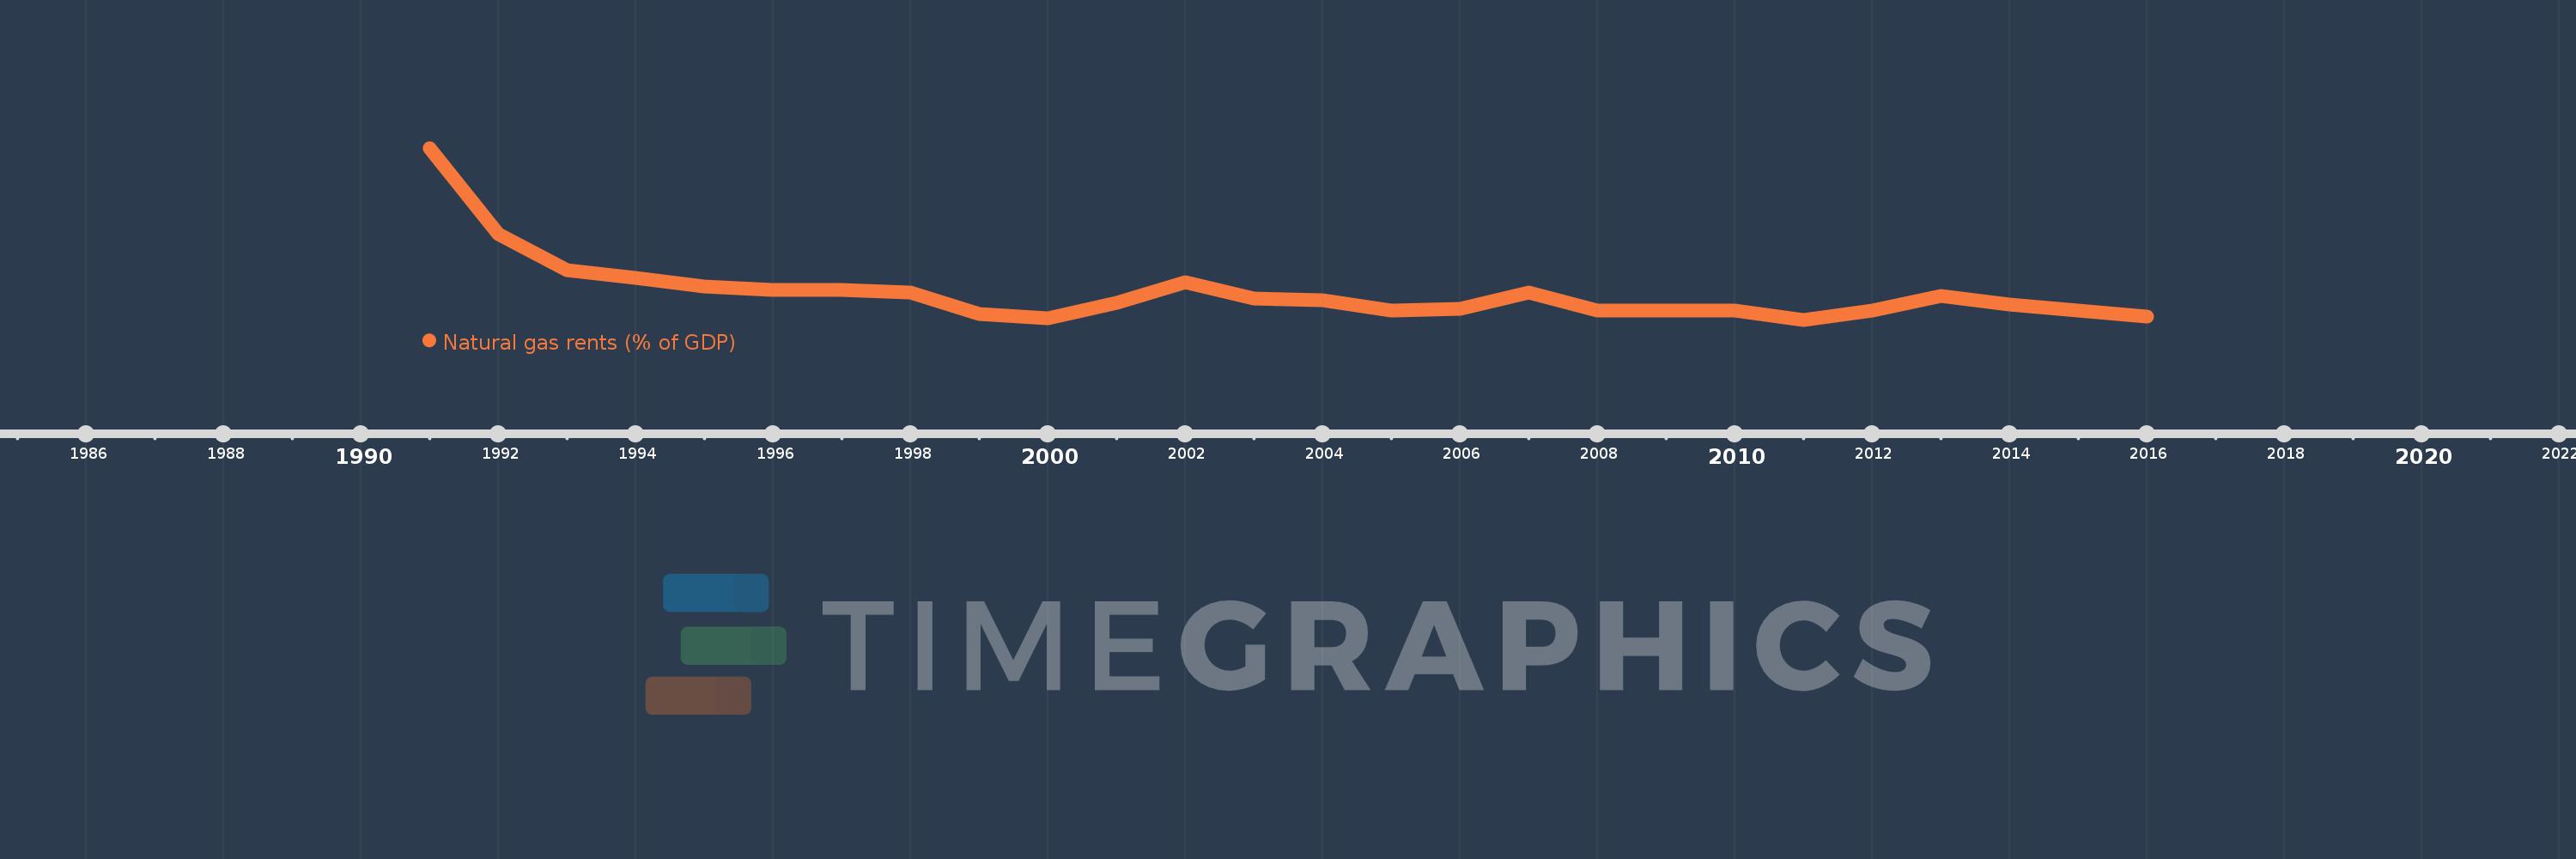
This timeline shows a graph from 1991 to 2016 of Slovak Republic. No data until 1990. Number of actual observations by date: 26.
Source name:
World Development Indicators
Source organization:
Estimates based on sources and methods described in "The Changing Wealth of Nations: Measuring Sustainable Development in the New Millennium" (World Bank, 2011).
Categories, topics:
Energy & Mining, Environment
Last updated:
apr 23, 2017
Indicators value changes by year
Meaning:
0.024
Minimum:
0.006
jan 1, 2011
Maximum:
0.12
jan 1, 1991
At the date of observation
Value
Absolute change
Change from the previous value
jan 1, 1991
0.12
+0.12
0.0%
jan 1, 1992
0.063
-0.057
-47.29%
jan 1, 1993
0.039
-0.024
-38.83%
jan 1, 1994
0.034
-0.004
-11.55%
jan 1, 1995
0.028
-0.006
-17.69%
jan 1, 1996
0.026
-0.002
-8.01%
jan 1, 1997
0.026
0.0
-0.17%
jan 1, 1998
0.024
-0.002
-8.38%
jan 1, 1999
0.01
-0.014
-59.05%
jan 1, 2000
0.007
-0.003
-32.02%
jan 1, 2001
0.017
+0.01
152.7%
jan 1, 2002
0.031
+0.015
87.92%
jan 1, 2003
0.02
-0.011
-36.01%
jan 1, 2004
0.019
-0.001
-4.7%
jan 1, 2005
0.012
-0.007
-37.74%
jan 1, 2006
0.013
+0.001
11.1%
jan 1, 2007
0.024
+0.011
82.9%
jan 1, 2008
0.012
-0.012
-50.63%
jan 1, 2009
0.012
+0.0
1.7%
jan 1, 2010
0.012
+0.0
0.24%
jan 1, 2011
0.006
-0.006
-52.9%
jan 1, 2012
0.012
+0.006
102.45%
jan 1, 2013
0.022
+0.011
93.46%
jan 1, 2014
0.016
-0.006
-28.93%
jan 1, 2015
0.012
-0.004
-23.24%
jan 1, 2016
0.008
-0.004
-31.26%
Ranking of countries by current statistics by years