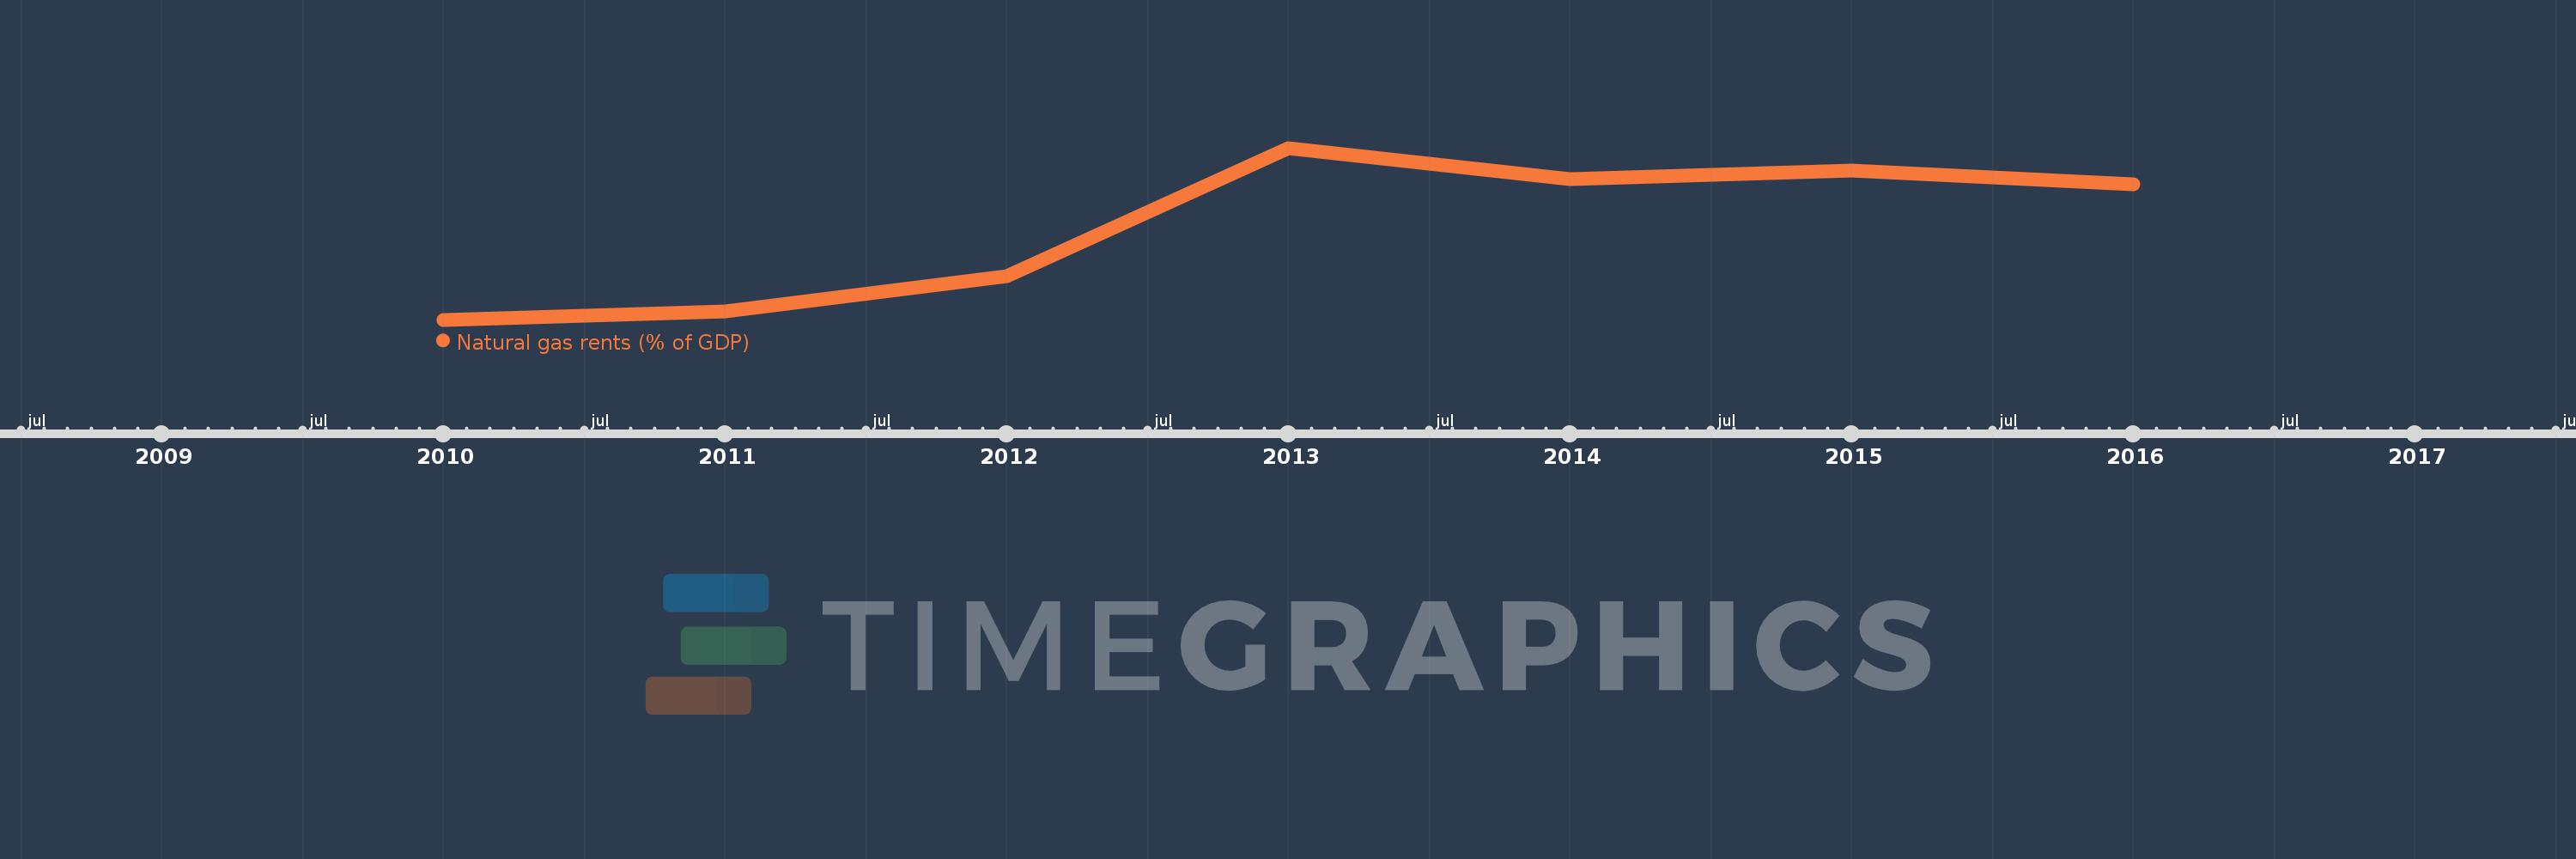
This timeline shows a graph from 2010 to 2016 of South Sudan. No data until 2009. Number of actual observations by date: 7.
Source name:
World Development Indicators
Source organization:
Estimates based on sources and methods described in "The Changing Wealth of Nations: Measuring Sustainable Development in the New Millennium" (World Bank, 2011).
Categories, topics:
Energy & Mining, Environment
Last updated:
apr 23, 2017
Indicators value changes by year
Meaning:
0.087
Minimum:
0.01
jan 1, 2010
Maximum:
0.152
jan 1, 2013
At the date of observation
Value
Absolute change
Change from the previous value
jan 1, 2010
0.01
+0.01
0.0%
jan 1, 2011
0.017
+0.007
67.63%
jan 1, 2012
0.046
+0.028
161.24%
jan 1, 2013
0.152
+0.106
232.65%
jan 1, 2014
0.126
-0.025
-16.69%
jan 1, 2015
0.133
+0.007
5.45%
jan 1, 2016
0.122
-0.011
-8.41%
Ranking of countries by current statistics by years