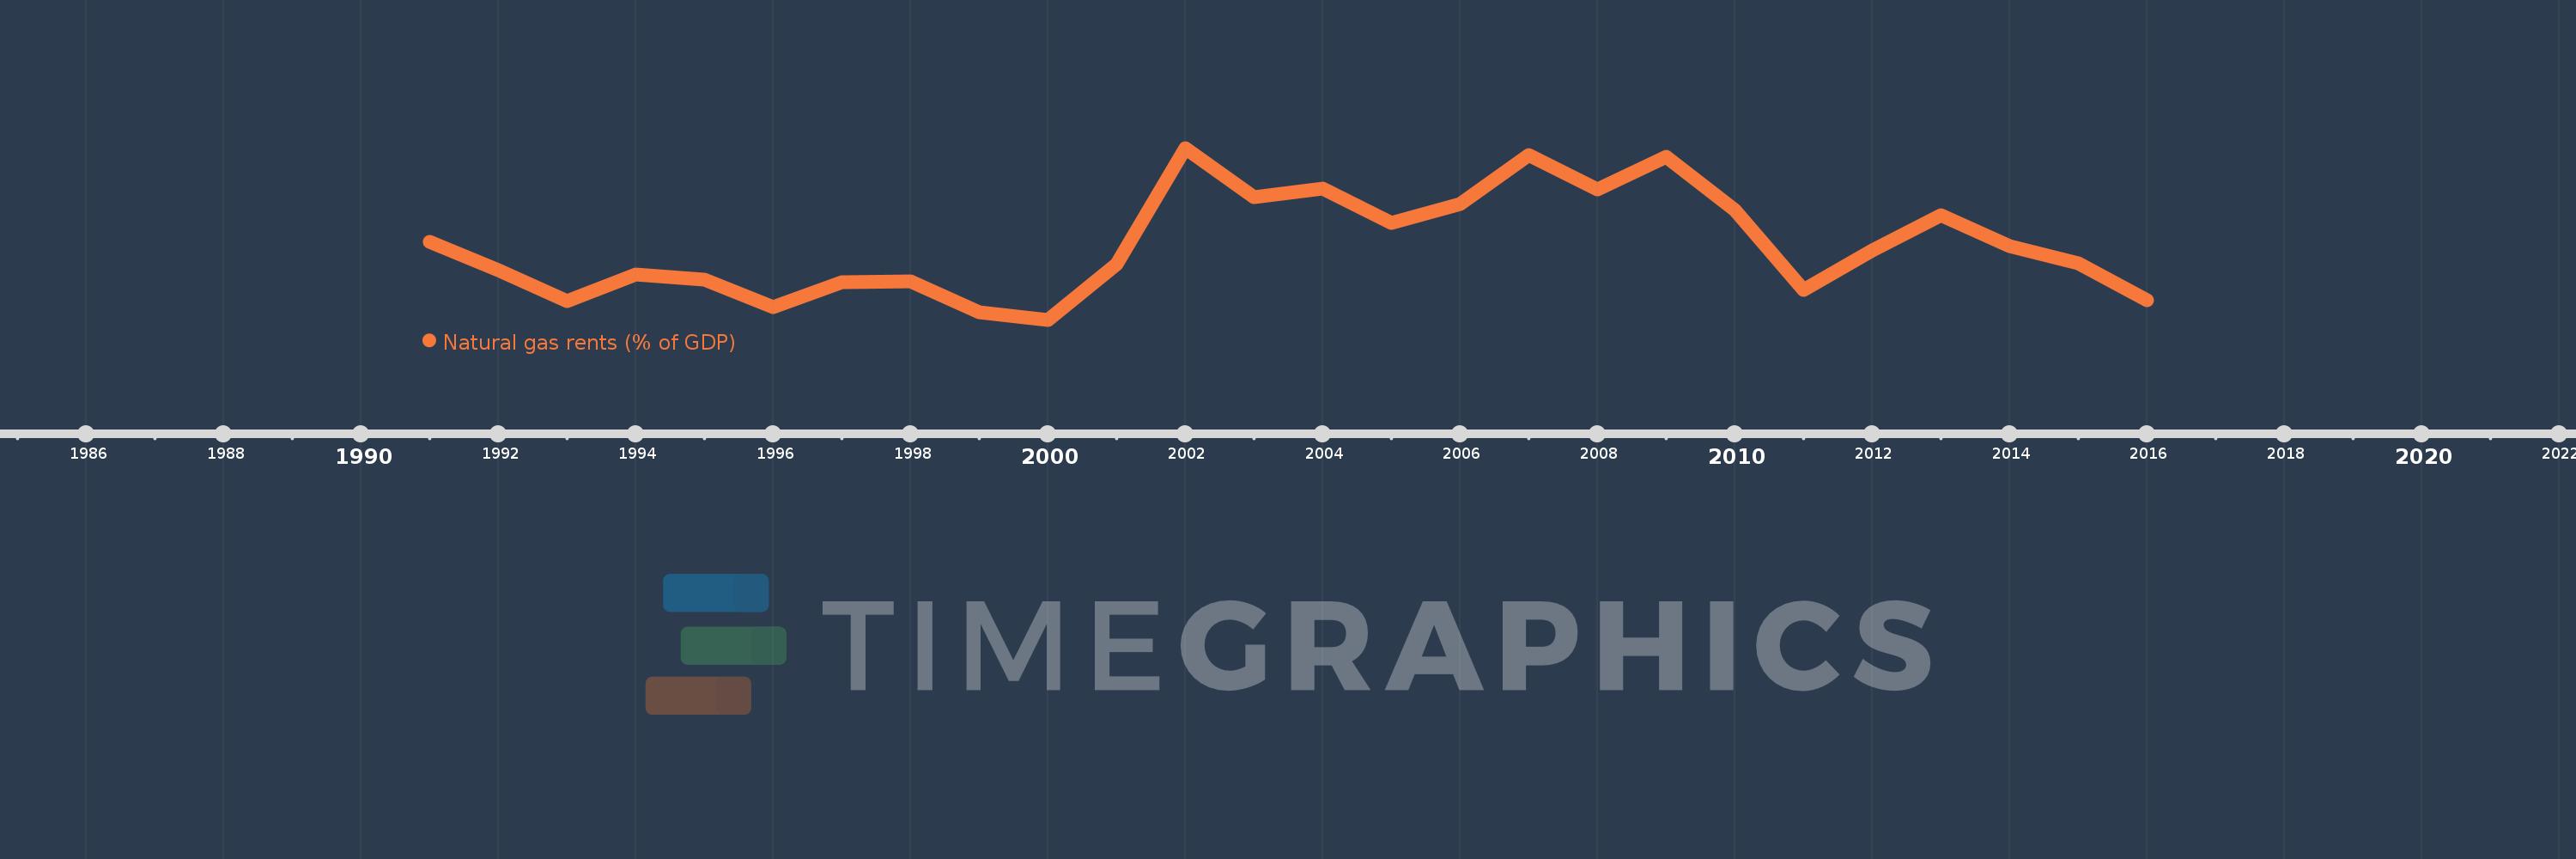
This timeline shows a graph from 1991 to 2016 of Uzbekistan. No data until 1990. Number of actual observations by date: 26.
Source name:
World Development Indicators
Source organization:
Estimates based on sources and methods described in "The Changing Wealth of Nations: Measuring Sustainable Development in the New Millennium" (World Bank, 2011).
Categories, topics:
Energy & Mining, Environment
Last updated:
apr 23, 2017
Indicators value changes by year
Meaning:
9.89
Minimum:
2.684
jan 1, 2000
Maximum:
19.265
jan 1, 2002
At the date of observation
Value
Absolute change
Change from the previous value
jan 1, 1991
10.216
+10.216
0.0%
jan 1, 1992
7.469
-2.748
-26.89%
jan 1, 1993
4.475
-2.993
-40.08%
jan 1, 1994
7.066
+2.59
57.88%
jan 1, 1995
6.591
-0.474
-6.71%
jan 1, 1996
3.903
-2.688
-40.78%
jan 1, 1997
6.324
+2.42
62.01%
jan 1, 1998
6.371
+0.047
0.75%
jan 1, 1999
3.39
-2.981
-46.8%
jan 1, 2000
2.684
-0.706
-20.82%
jan 1, 2001
8.015
+5.331
198.6%
jan 1, 2002
19.265
+11.25
140.37%
jan 1, 2003
14.521
-4.744
-24.63%
jan 1, 2004
15.325
+0.805
5.54%
jan 1, 2005
12.058
-3.267
-21.32%
jan 1, 2006
13.872
+1.814
15.04%
jan 1, 2007
18.54
+4.668
33.65%
jan 1, 2008
15.236
-3.304
-17.82%
jan 1, 2009
18.401
+3.165
20.78%
jan 1, 2010
13.244
-5.157
-28.03%
jan 1, 2011
5.549
-7.695
-58.1%
jan 1, 2012
9.367
+3.819
68.82%
jan 1, 2013
12.75
+3.383
36.11%
jan 1, 2014
9.787
-2.963
-23.24%
jan 1, 2015
8.148
-1.639
-16.75%
jan 1, 2016
4.576
-3.572
-43.84%
Ranking of countries by current statistics by years