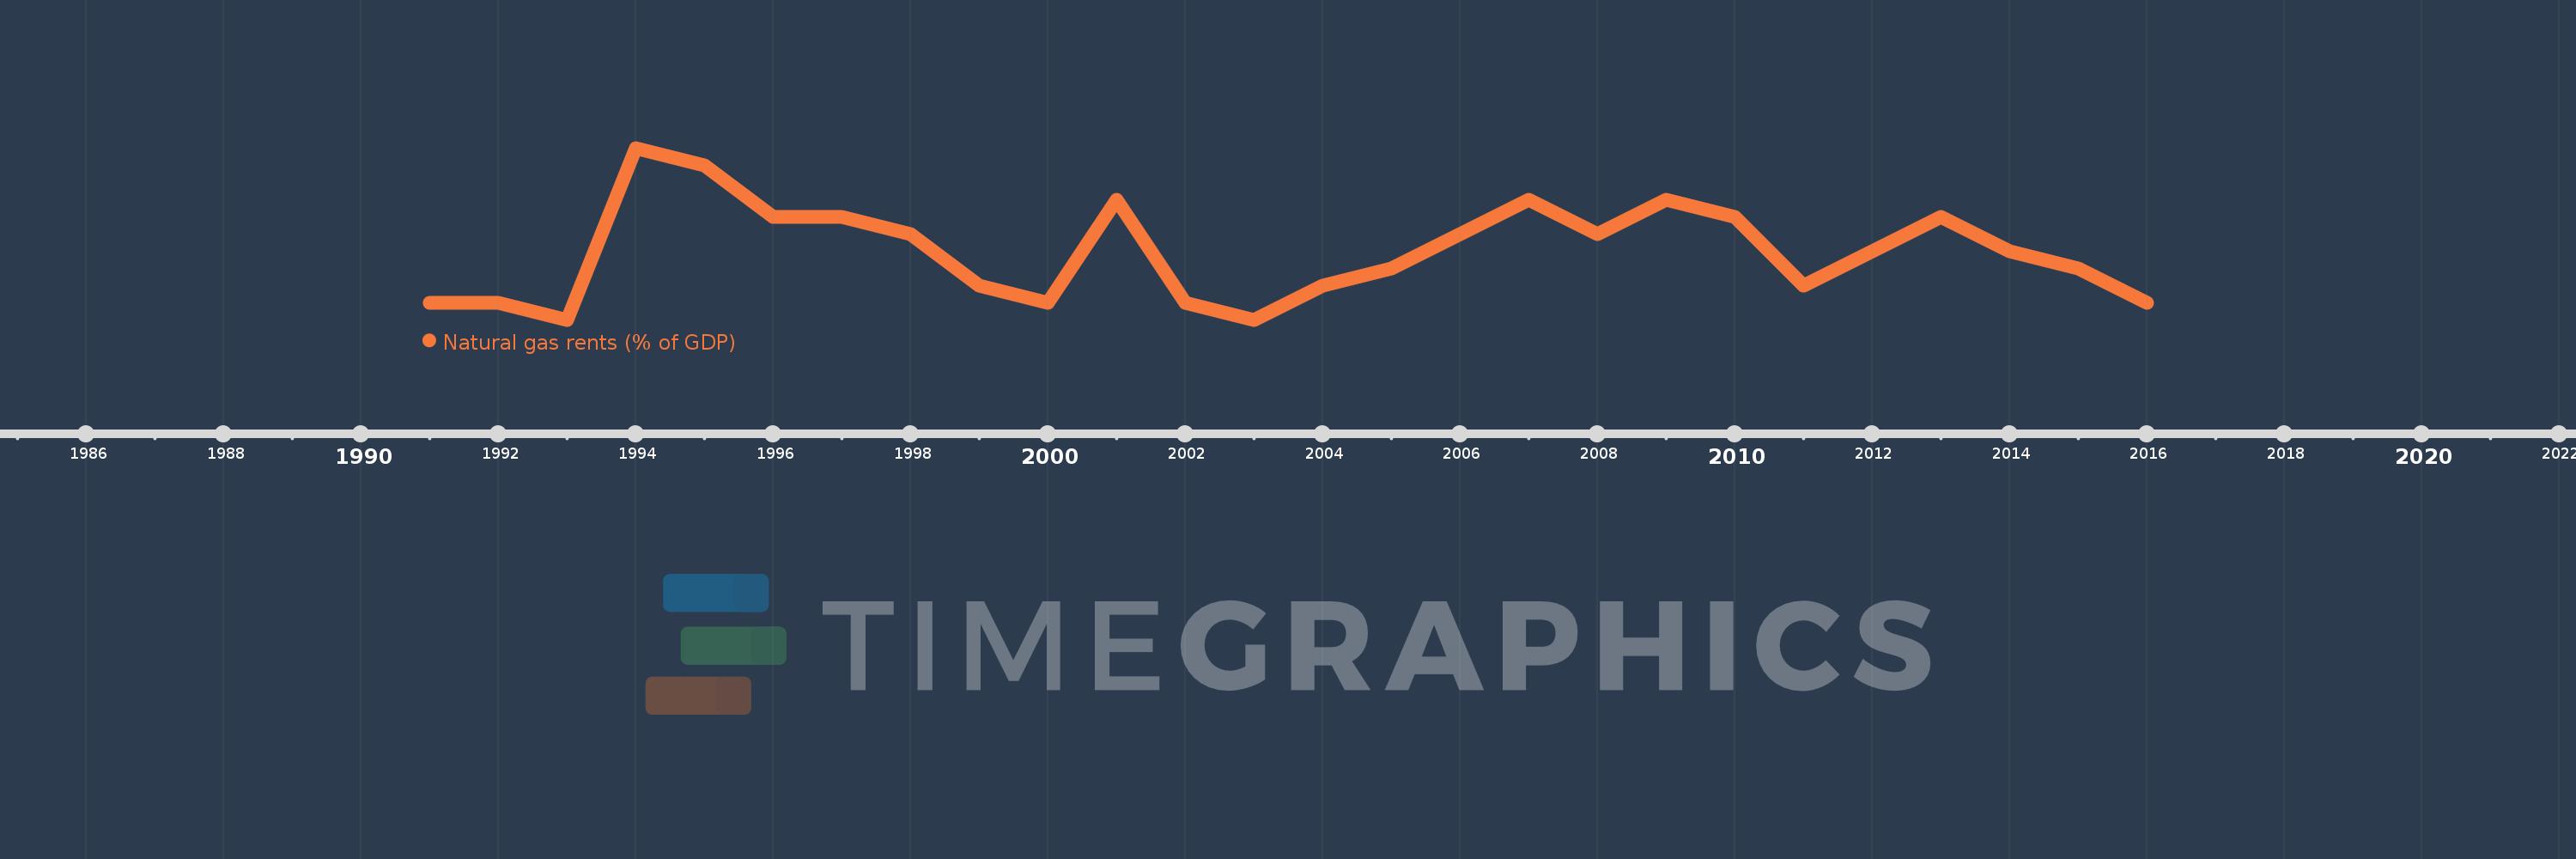
This timeline shows a graph from 1991 to 2016 of Czech Republic. No data until 1990. Number of actual observations by date: 26.
Source name:
World Development Indicators
Source organization:
Estimates based on sources and methods described in "The Changing Wealth of Nations: Measuring Sustainable Development in the New Millennium" (World Bank, 2011).
Categories, topics:
Energy & Mining, Environment
Last updated:
apr 23, 2017
Indicators value changes by year
Meaning:
0.006
Minimum:
0.002
jan 1, 1993
Maximum:
0.012
jan 1, 1994
At the date of observation
Value
Absolute change
Change from the previous value
jan 1, 1991
0.003
+0.003
0.0%
jan 1, 1992
0.003
-0.001
-21.9%
jan 1, 1993
0.002
-0.001
-43.01%
jan 1, 1994
0.012
+0.011
692.03%
jan 1, 1995
0.011
-0.001
-8.37%
jan 1, 1996
0.008
-0.004
-31.48%
jan 1, 1997
0.008
0.0
-0.78%
jan 1, 1998
0.007
0.0
-3.2%
jan 1, 1999
0.004
-0.004
-51.28%
jan 1, 2000
0.003
0.0
-12.51%
jan 1, 2001
0.009
+0.006
199.76%
jan 1, 2002
0.003
-0.007
-71.47%
jan 1, 2003
0.002
-0.001
-37.65%
jan 1, 2004
0.004
+0.003
164.54%
jan 1, 2005
0.005
+0.0
2.27%
jan 1, 2006
0.007
+0.002
52.07%
jan 1, 2007
0.009
+0.002
26.67%
jan 1, 2008
0.007
-0.002
-18.08%
jan 1, 2009
0.009
+0.001
19.34%
jan 1, 2010
0.008
-0.001
-9.36%
jan 1, 2011
0.004
-0.004
-46.65%
jan 1, 2012
0.006
+0.002
57.27%
jan 1, 2013
0.008
+0.002
27.97%
jan 1, 2014
0.006
-0.002
-28.2%
jan 1, 2015
0.005
-0.001
-21.49%
jan 1, 2016
0.003
-0.002
-41.8%
Ranking of countries by current statistics by years