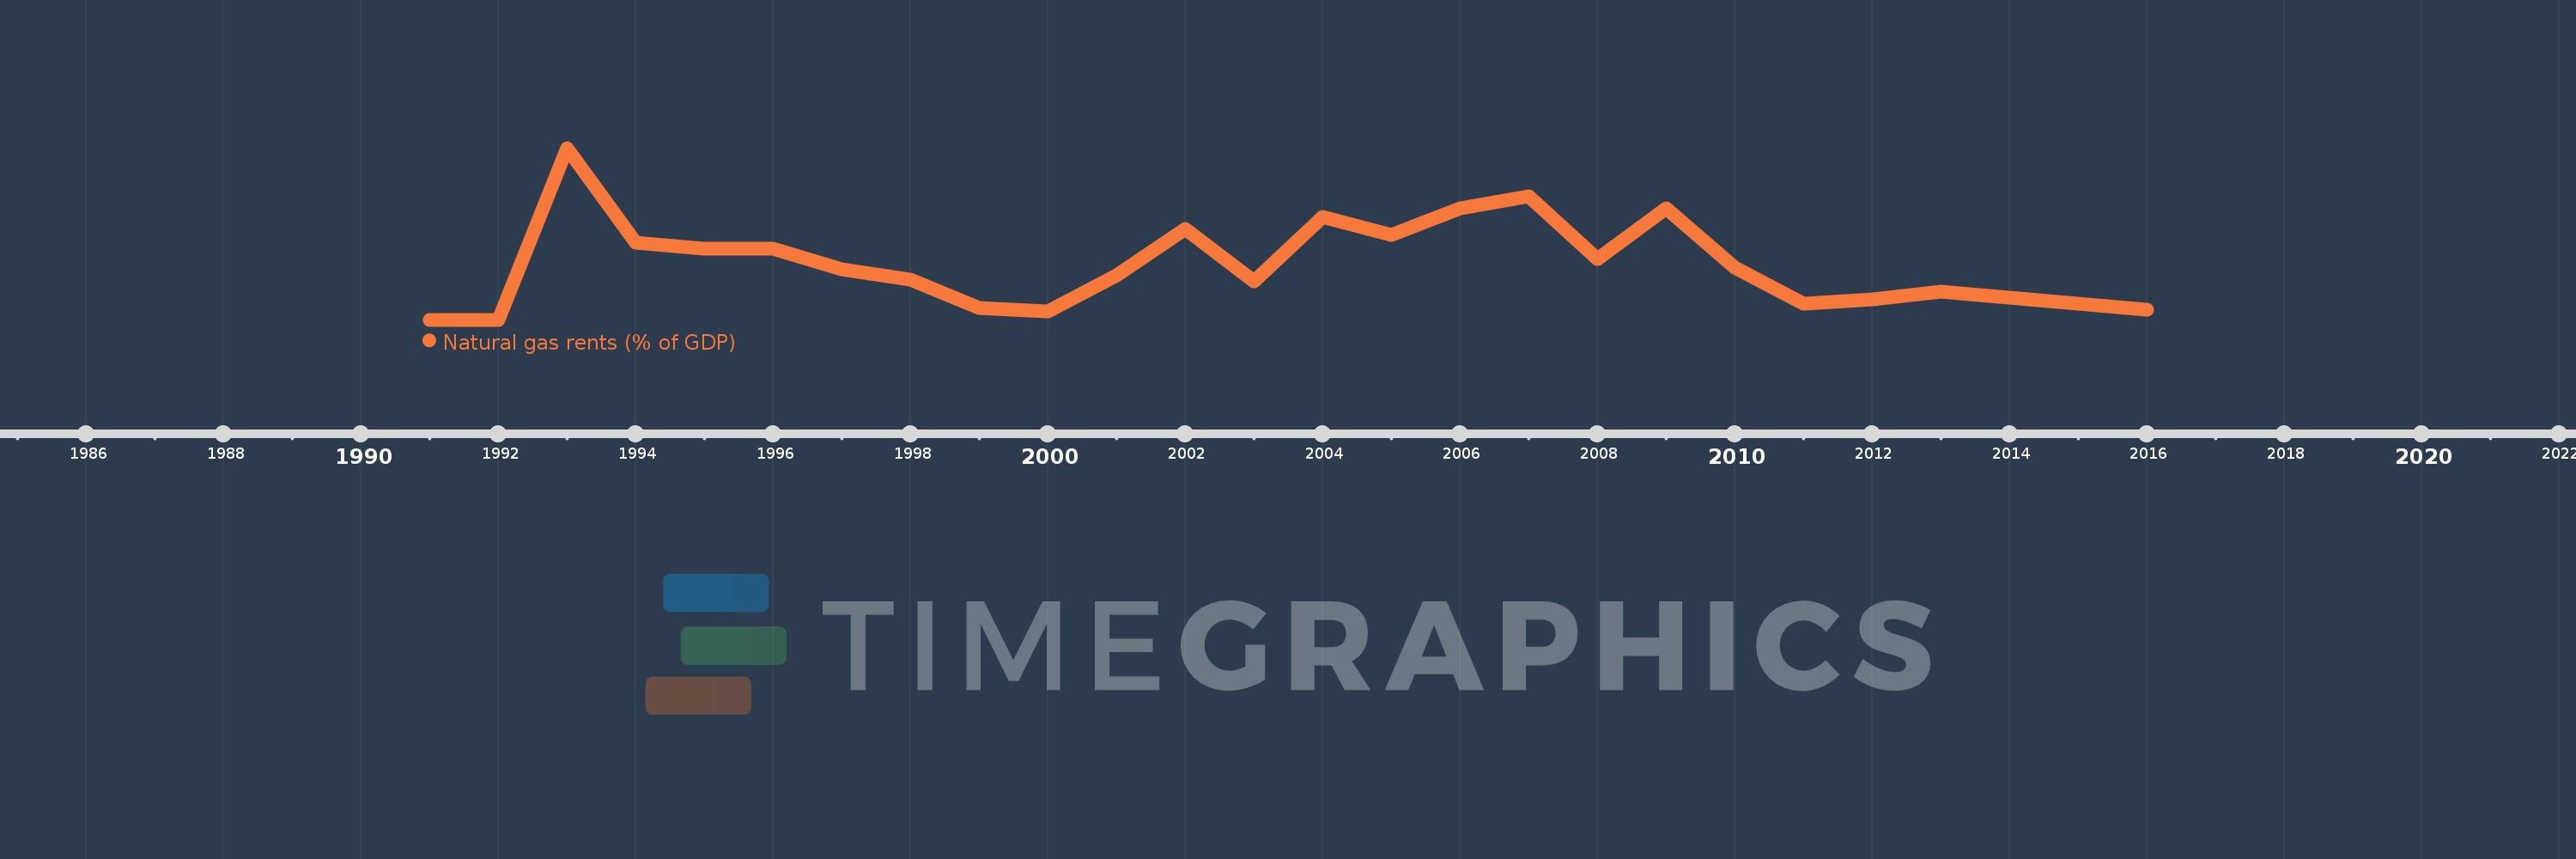
This timeline shows a graph from 1991 to 2016 of Kyrgyz Republic. No data until 1990. Number of actual observations by date: 26.
Source name:
World Development Indicators
Source organization:
Estimates based on sources and methods described in "The Changing Wealth of Nations: Measuring Sustainable Development in the New Millennium" (World Bank, 2011).
Categories, topics:
Energy & Mining, Environment
Last updated:
apr 23, 2017
Indicators value changes by year
Meaning:
0.03
Minimum:
0.003
jan 1, 1992
Maximum:
0.088
jan 1, 1993
At the date of observation
Value
Absolute change
Change from the previous value
jan 1, 1991
0.003
+0.003
0.0%
jan 1, 1992
0.003
0.0
-10.88%
jan 1, 1993
0.088
+0.085
3.06K%
jan 1, 1994
0.041
-0.047
-53.45%
jan 1, 1995
0.038
-0.003
-6.47%
jan 1, 1996
0.038
0.0
-0.29%
jan 1, 1997
0.028
-0.01
-25.71%
jan 1, 1998
0.023
-0.006
-19.57%
jan 1, 1999
0.009
-0.014
-61.15%
jan 1, 2000
0.007
-0.002
-20.36%
jan 1, 2001
0.025
+0.018
254.44%
jan 1, 2002
0.048
+0.023
92.69%
jan 1, 2003
0.022
-0.026
-55.01%
jan 1, 2004
0.054
+0.033
151.04%
jan 1, 2005
0.045
-0.009
-16.45%
jan 1, 2006
0.058
+0.012
27.07%
jan 1, 2007
0.064
+0.006
11.2%
jan 1, 2008
0.033
-0.031
-48.45%
jan 1, 2009
0.058
+0.025
76.78%
jan 1, 2010
0.029
-0.029
-50.0%
jan 1, 2011
0.011
-0.018
-62.64%
jan 1, 2012
0.013
+0.002
17.84%
jan 1, 2013
0.017
+0.005
35.79%
jan 1, 2014
0.014
-0.004
-20.19%
jan 1, 2015
0.011
-0.003
-19.48%
jan 1, 2016
0.008
-0.003
-28.95%
Ranking of countries by current statistics by years