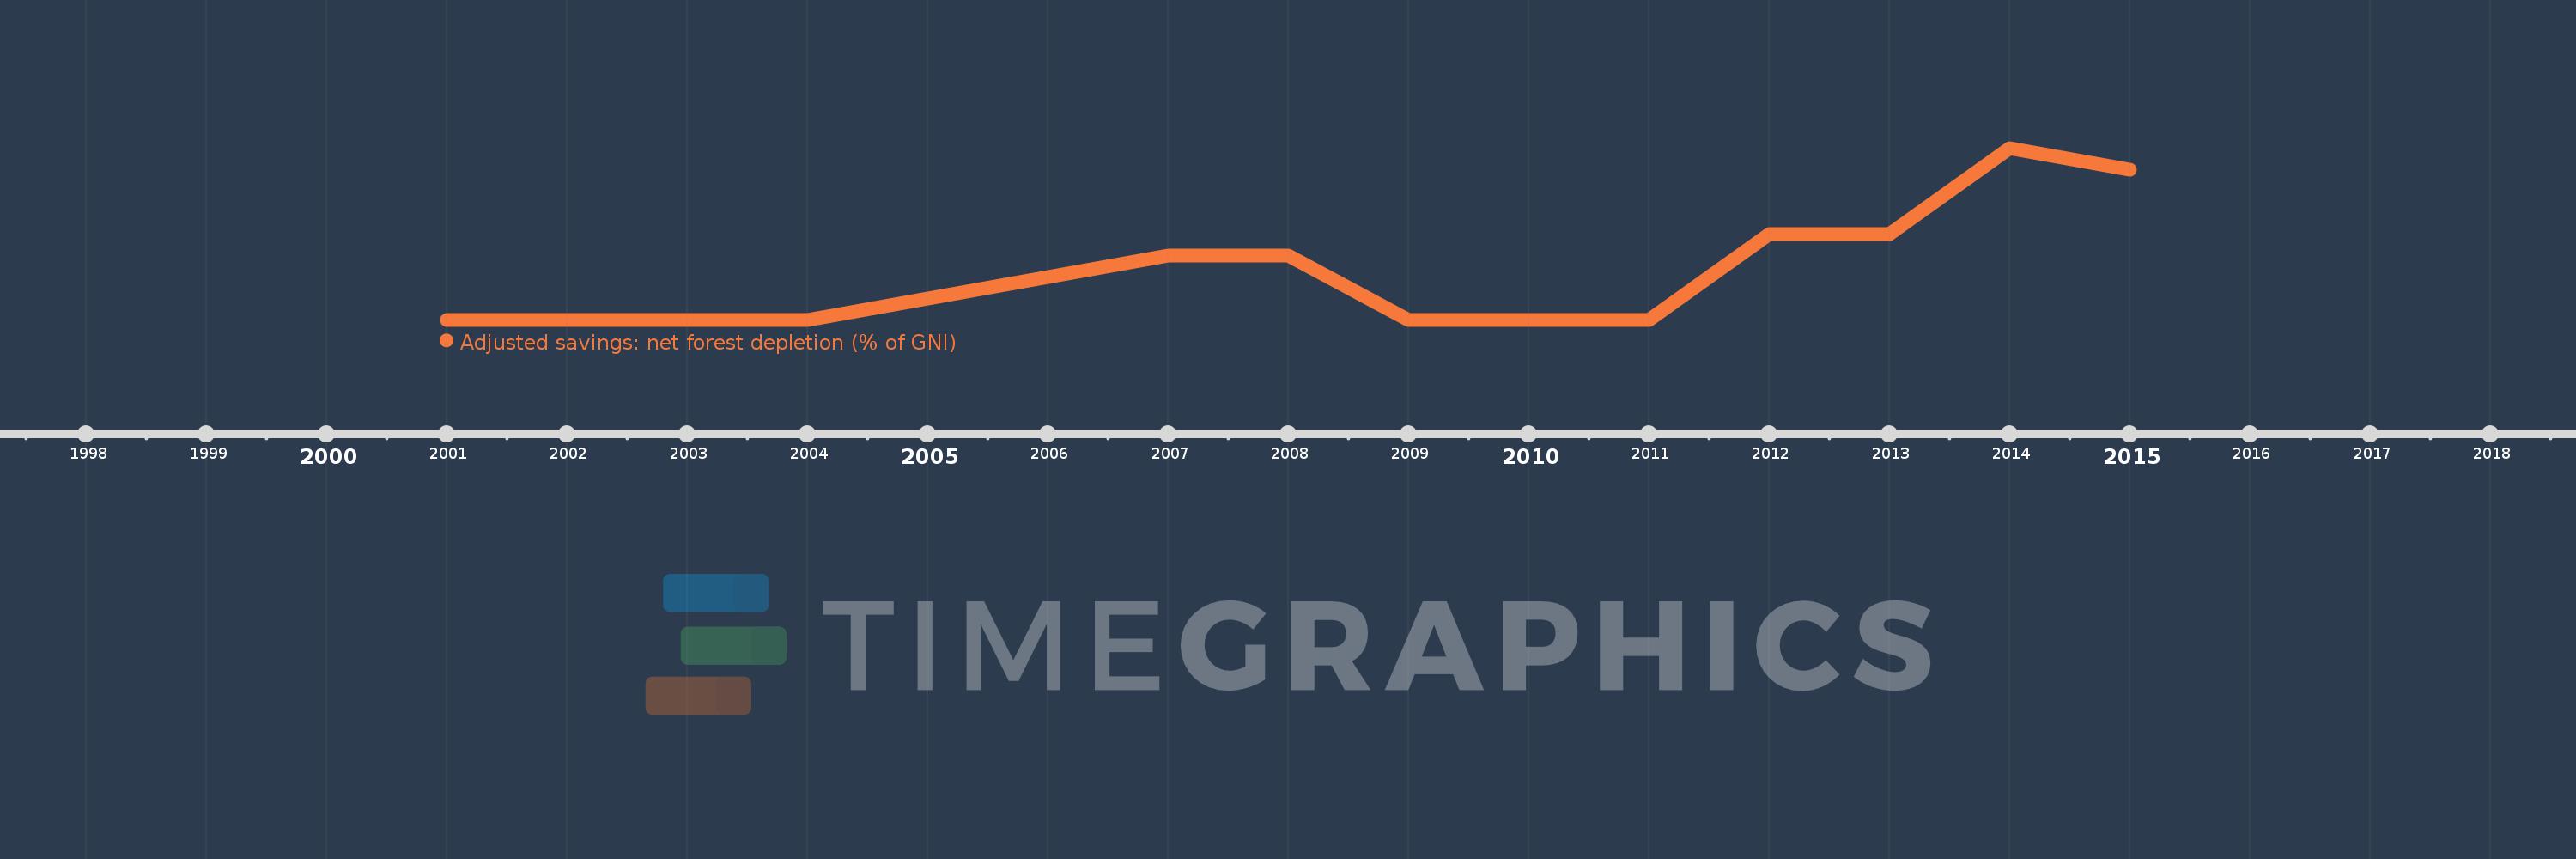
This timeline shows a graph from 2001 to 2015 of Belgium. No data until 2000. Number of actual observations by date: 15.
Source name:
World Development Indicators
Source organization:
World Bank staff estimates based on sources and methods in World Bank's "The Changing Wealth of Nations: Measuring Sustainable Development in the New Millennium" (2011).
Categories, topics:
Economy & Growth, Environment
Last updated:
apr 23, 2017
Indicators value changes by year
Meaning:
0.002
Minimum:
0.0
jan 1, 2001
Maximum:
0.008
jan 1, 2014
At the date of observation
Value
Absolute change
Change from the previous value
jan 1, 2001
0.0
0.0
0.0%
jan 1, 2002
0.0
0.0
%
jan 1, 2003
0.0
0.0
%
jan 1, 2004
0.0
+0.0
%
jan 1, 2005
0.001
+0.001
771.55%
jan 1, 2006
0.002
+0.001
109.4%
jan 1, 2007
0.003
+0.001
80.07%
jan 1, 2008
0.003
0.0
-13.84%
jan 1, 2009
0.0
-0.003
-100.0%
jan 1, 2010
0.0
0.0
%
jan 1, 2011
0.0
+0.0
%
jan 1, 2012
0.004
+0.003
779.51%
jan 1, 2013
0.004
+0.0
1.01%
jan 1, 2014
0.008
+0.004
103.09%
jan 1, 2015
0.007
-0.001
-11.14%
Ranking of countries by current statistics by years