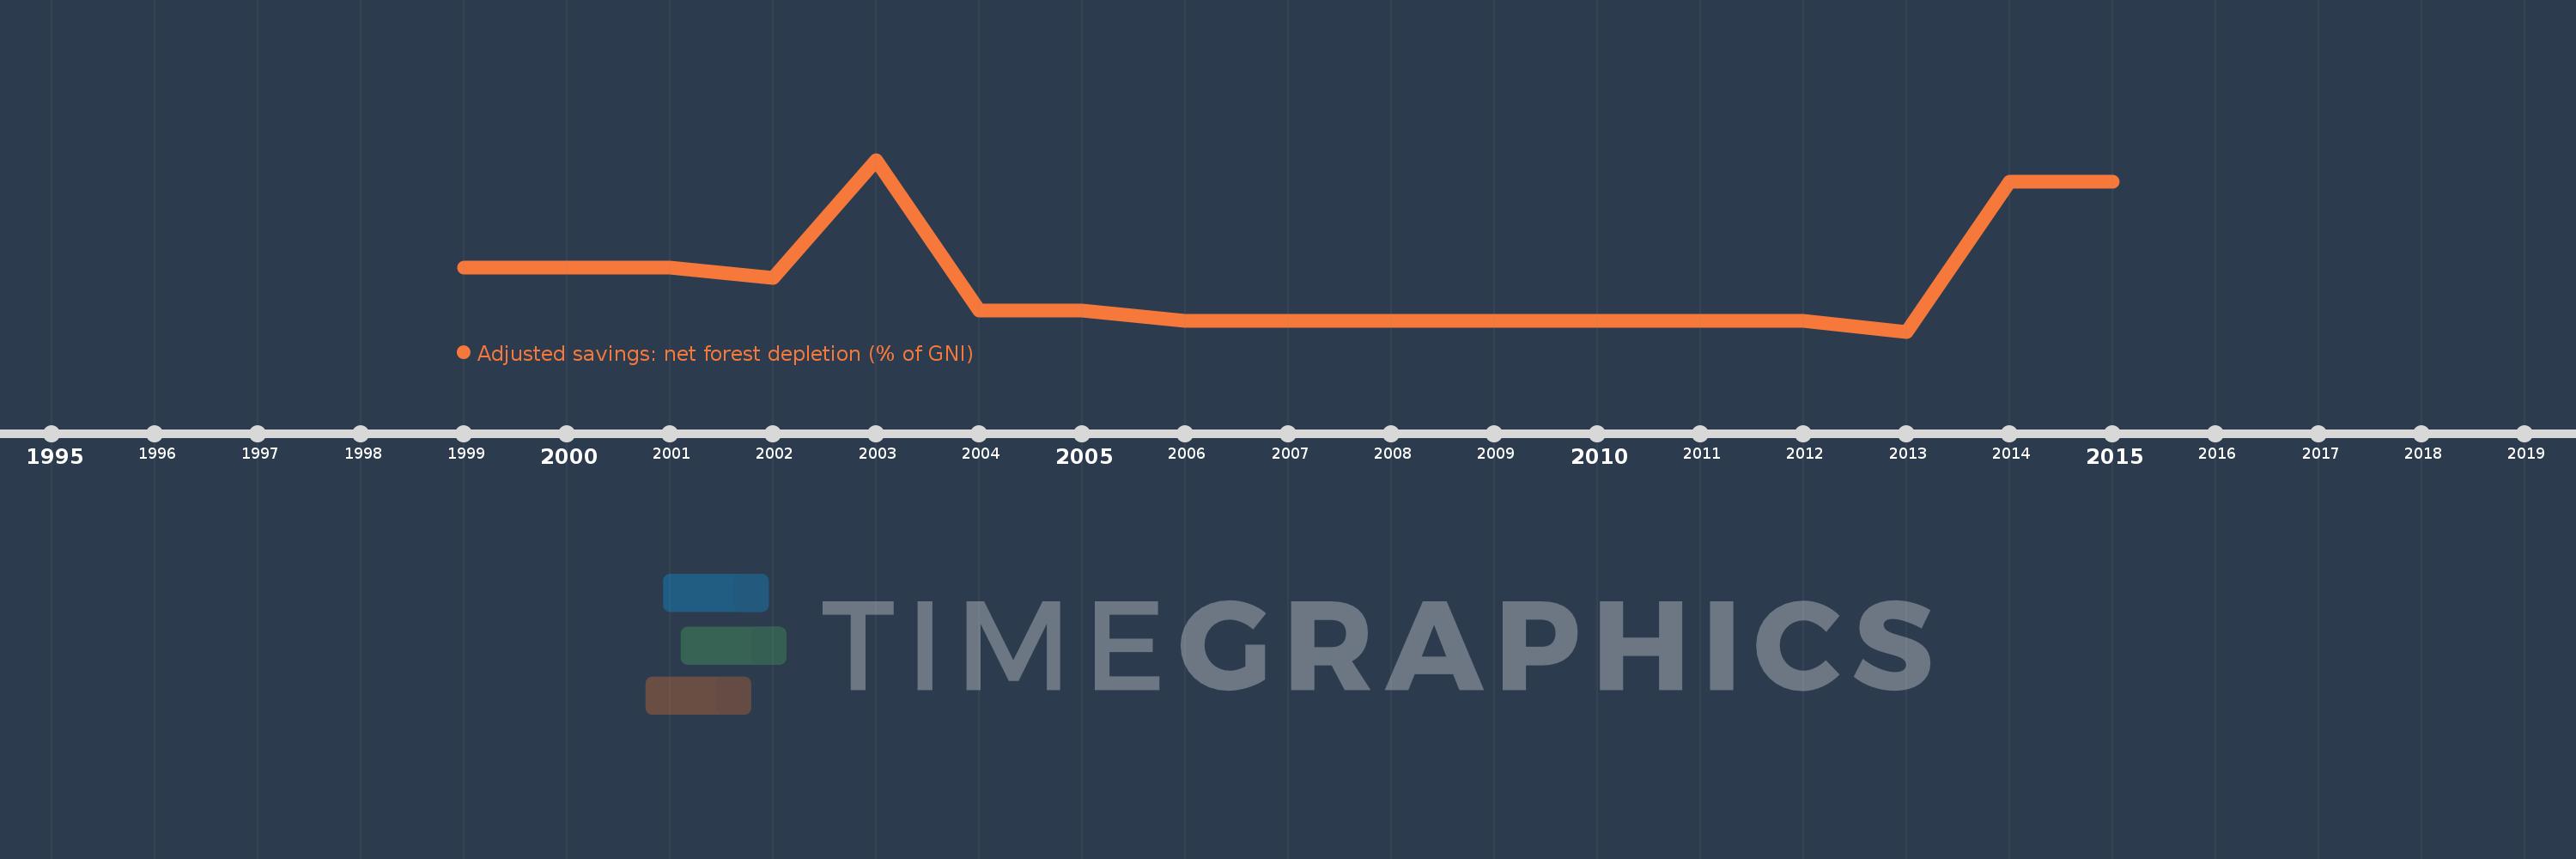
This timeline shows a graph from 1999 to 2015 of Azerbaijan. No data until 1998. Number of actual observations by date: 17.
Source name:
World Development Indicators
Source organization:
World Bank staff estimates based on sources and methods in World Bank's "The Changing Wealth of Nations: Measuring Sustainable Development in the New Millennium" (2011).
Categories, topics:
Economy & Growth, Environment
Last updated:
apr 23, 2017
Indicators value changes by year
Meaning:
0.005
Minimum:
0.0
jan 1, 2013
Maximum:
0.016
jan 1, 2003
At the date of observation
Value
Absolute change
Change from the previous value
jan 1, 1999
0.006
+0.006
0.0%
jan 1, 2000
0.006
+0.001
9.92%
jan 1, 2001
0.006
-0.001
-9.24%
jan 1, 2002
0.005
0.0
-8.67%
jan 1, 2003
0.016
+0.011
219.45%
jan 1, 2004
0.002
-0.014
-85.03%
jan 1, 2005
0.002
0.0
-11.31%
jan 1, 2006
0.001
-0.001
-31.02%
jan 1, 2007
0.001
0.0
-21.16%
jan 1, 2008
0.001
0.0
-24.75%
jan 1, 2009
0.001
0.0
-19.83%
jan 1, 2010
0.001
+0.0
5.62%
jan 1, 2011
0.001
0.0
-25.69%
jan 1, 2012
0.001
+0.0
6.62%
jan 1, 2013
0.0
0.0
-19.56%
jan 1, 2014
0.014
+0.013
2.75K%
jan 1, 2015
0.014
+0.001
3.69%
Ranking of countries by current statistics by years