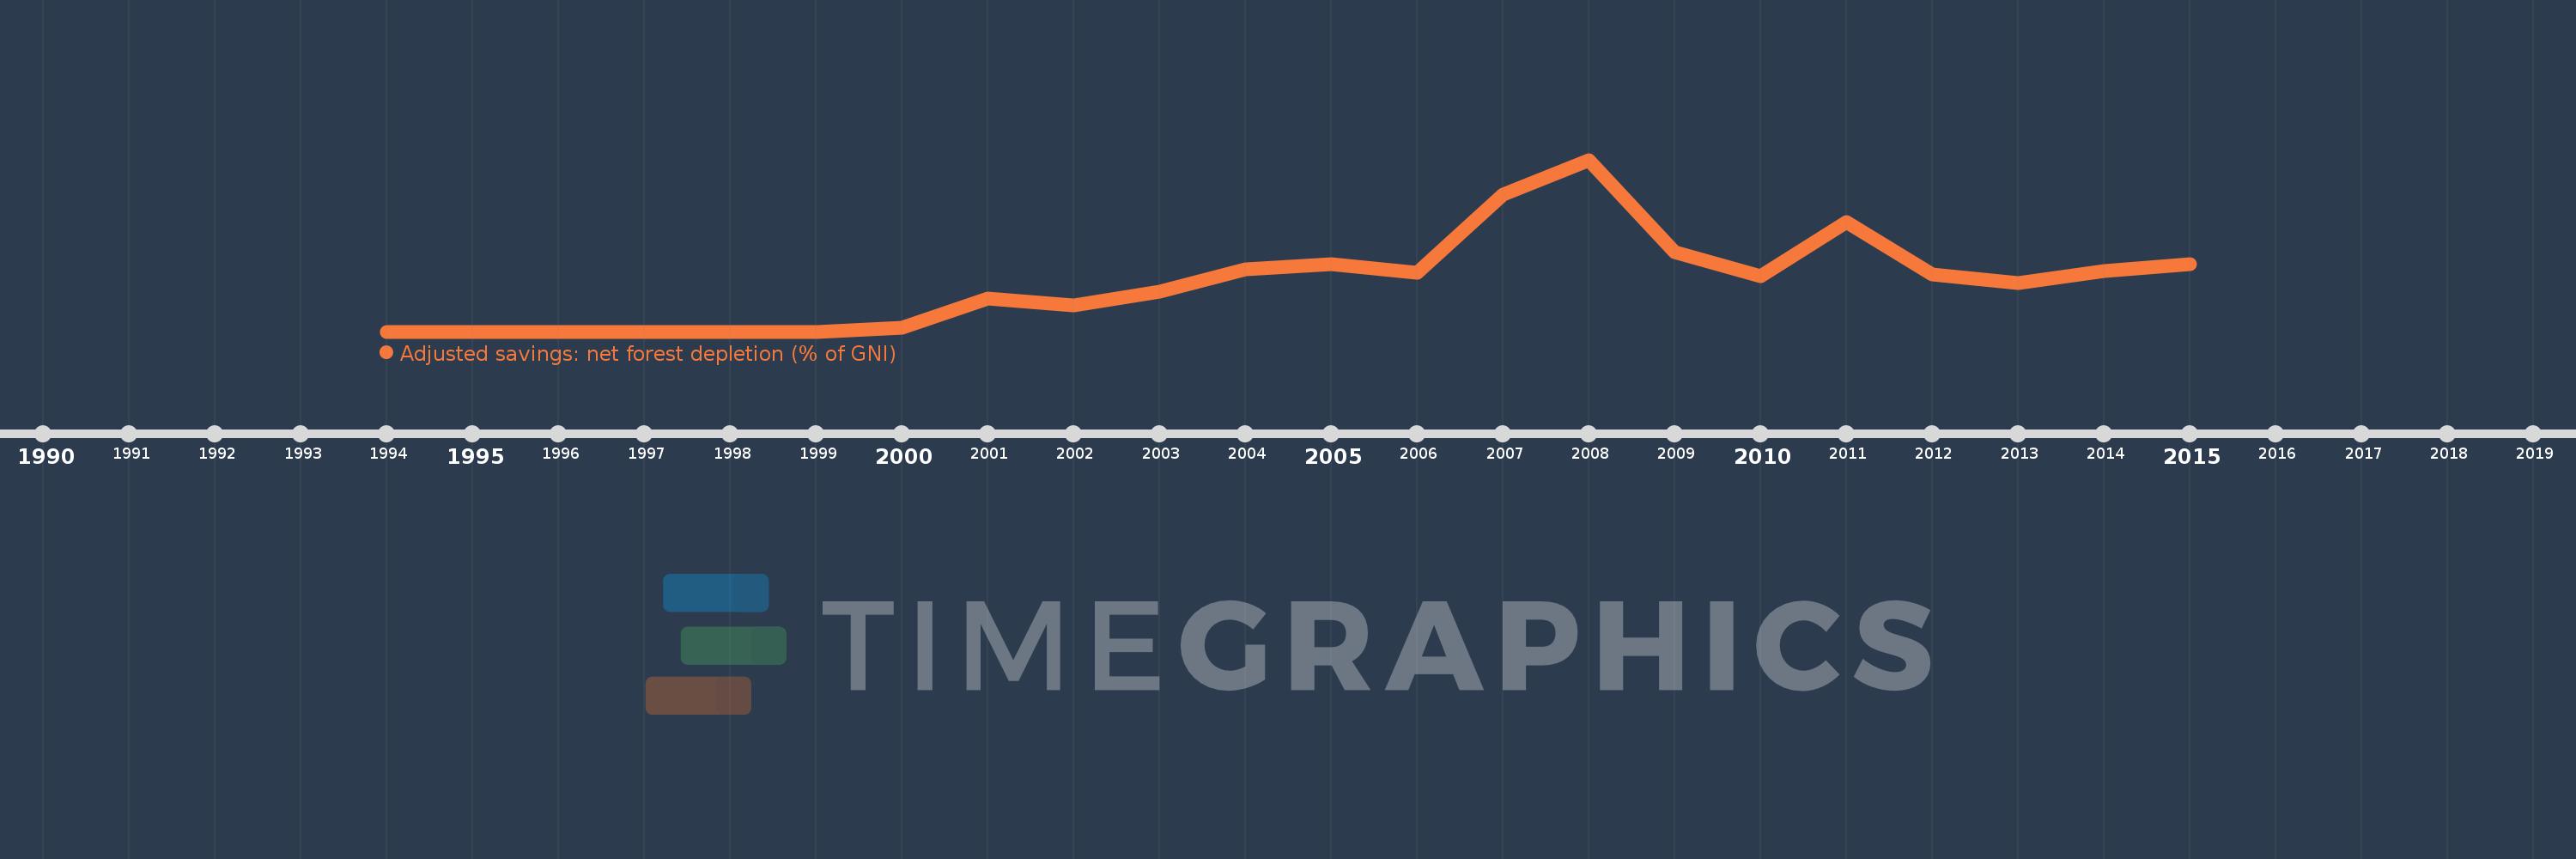
This timeline shows a graph from 1994 to 2015 of Czech Republic. No data until 1993. Number of actual observations by date: 22.
Source name:
World Development Indicators
Source organization:
World Bank staff estimates based on sources and methods in World Bank's "The Changing Wealth of Nations: Measuring Sustainable Development in the New Millennium" (2011).
Categories, topics:
Economy & Growth, Environment
Last updated:
apr 23, 2017
Indicators value changes by year
Meaning:
0.028
Minimum:
0.0
jan 1, 1994
Maximum:
0.099
jan 1, 2008
At the date of observation
Value
Absolute change
Change from the previous value
jan 1, 1994
0.0
0.0
0.0%
jan 1, 1995
0.0
0.0
%
jan 1, 1996
0.0
0.0
%
jan 1, 1997
0.0
0.0
%
jan 1, 1998
0.0
0.0
%
jan 1, 1999
0.0
0.0
%
jan 1, 2000
0.002
+0.002
%
jan 1, 2001
0.019
+0.017
715.27%
jan 1, 2002
0.015
-0.004
-22.19%
jan 1, 2003
0.023
+0.008
55.65%
jan 1, 2004
0.036
+0.013
55.2%
jan 1, 2005
0.039
+0.003
7.96%
jan 1, 2006
0.034
-0.005
-12.05%
jan 1, 2007
0.079
+0.045
130.81%
jan 1, 2008
0.099
+0.02
24.75%
jan 1, 2009
0.046
-0.053
-53.83%
jan 1, 2010
0.032
-0.013
-28.92%
jan 1, 2011
0.063
+0.031
94.32%
jan 1, 2012
0.033
-0.03
-47.11%
jan 1, 2013
0.028
-0.006
-16.78%
jan 1, 2014
0.035
+0.007
24.55%
jan 1, 2015
0.039
+0.005
13.8%
Ranking of countries by current statistics by years