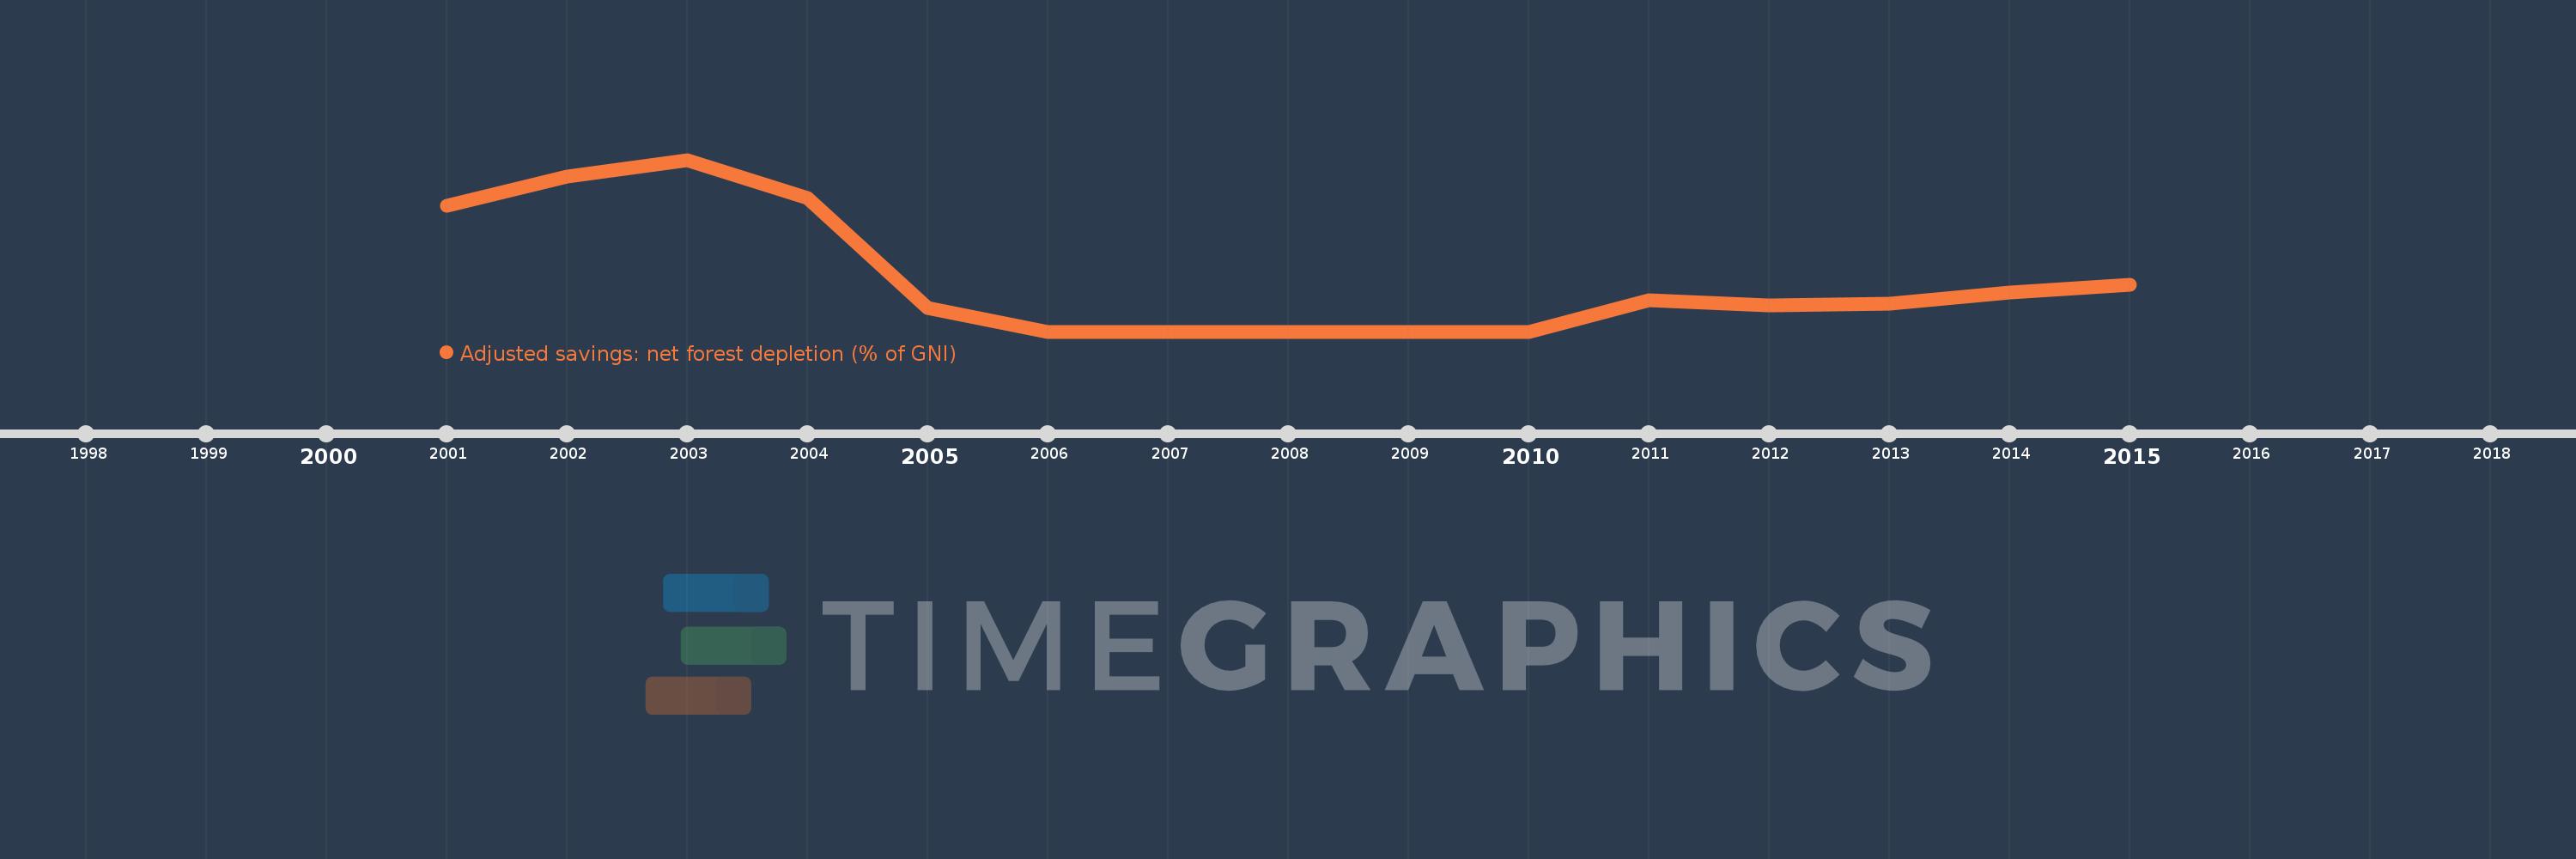
This timeline shows a graph from 2001 to 2015 of Estonia. No data until 2000. Number of actual observations by date: 15.
Source name:
World Development Indicators
Source organization:
World Bank staff estimates based on sources and methods in World Bank's "The Changing Wealth of Nations: Measuring Sustainable Development in the New Millennium" (2011).
Categories, topics:
Economy & Growth, Environment
Last updated:
apr 23, 2017
Indicators value changes by year
Meaning:
0.681
Minimum:
0.0
jan 1, 2006
Maximum:
2.247
jan 1, 2003
At the date of observation
Value
Absolute change
Change from the previous value
jan 1, 2001
1.648
+1.648
0.0%
jan 1, 2002
2.032
+0.384
23.28%
jan 1, 2003
2.247
+0.215
10.58%
jan 1, 2004
1.743
-0.504
-22.42%
jan 1, 2005
0.31
-1.434
-82.24%
jan 1, 2006
0.0
-0.31
-100.0%
jan 1, 2007
0.0
0.0
%
jan 1, 2008
0.0
0.0
%
jan 1, 2009
0.0
0.0
%
jan 1, 2010
0.0
0.0
%
jan 1, 2011
0.411
+0.411
%
jan 1, 2012
0.338
-0.073
-17.86%
jan 1, 2013
0.362
+0.024
7.11%
jan 1, 2014
0.51
+0.148
40.88%
jan 1, 2015
0.613
+0.103
20.3%
Ranking of countries by current statistics by years