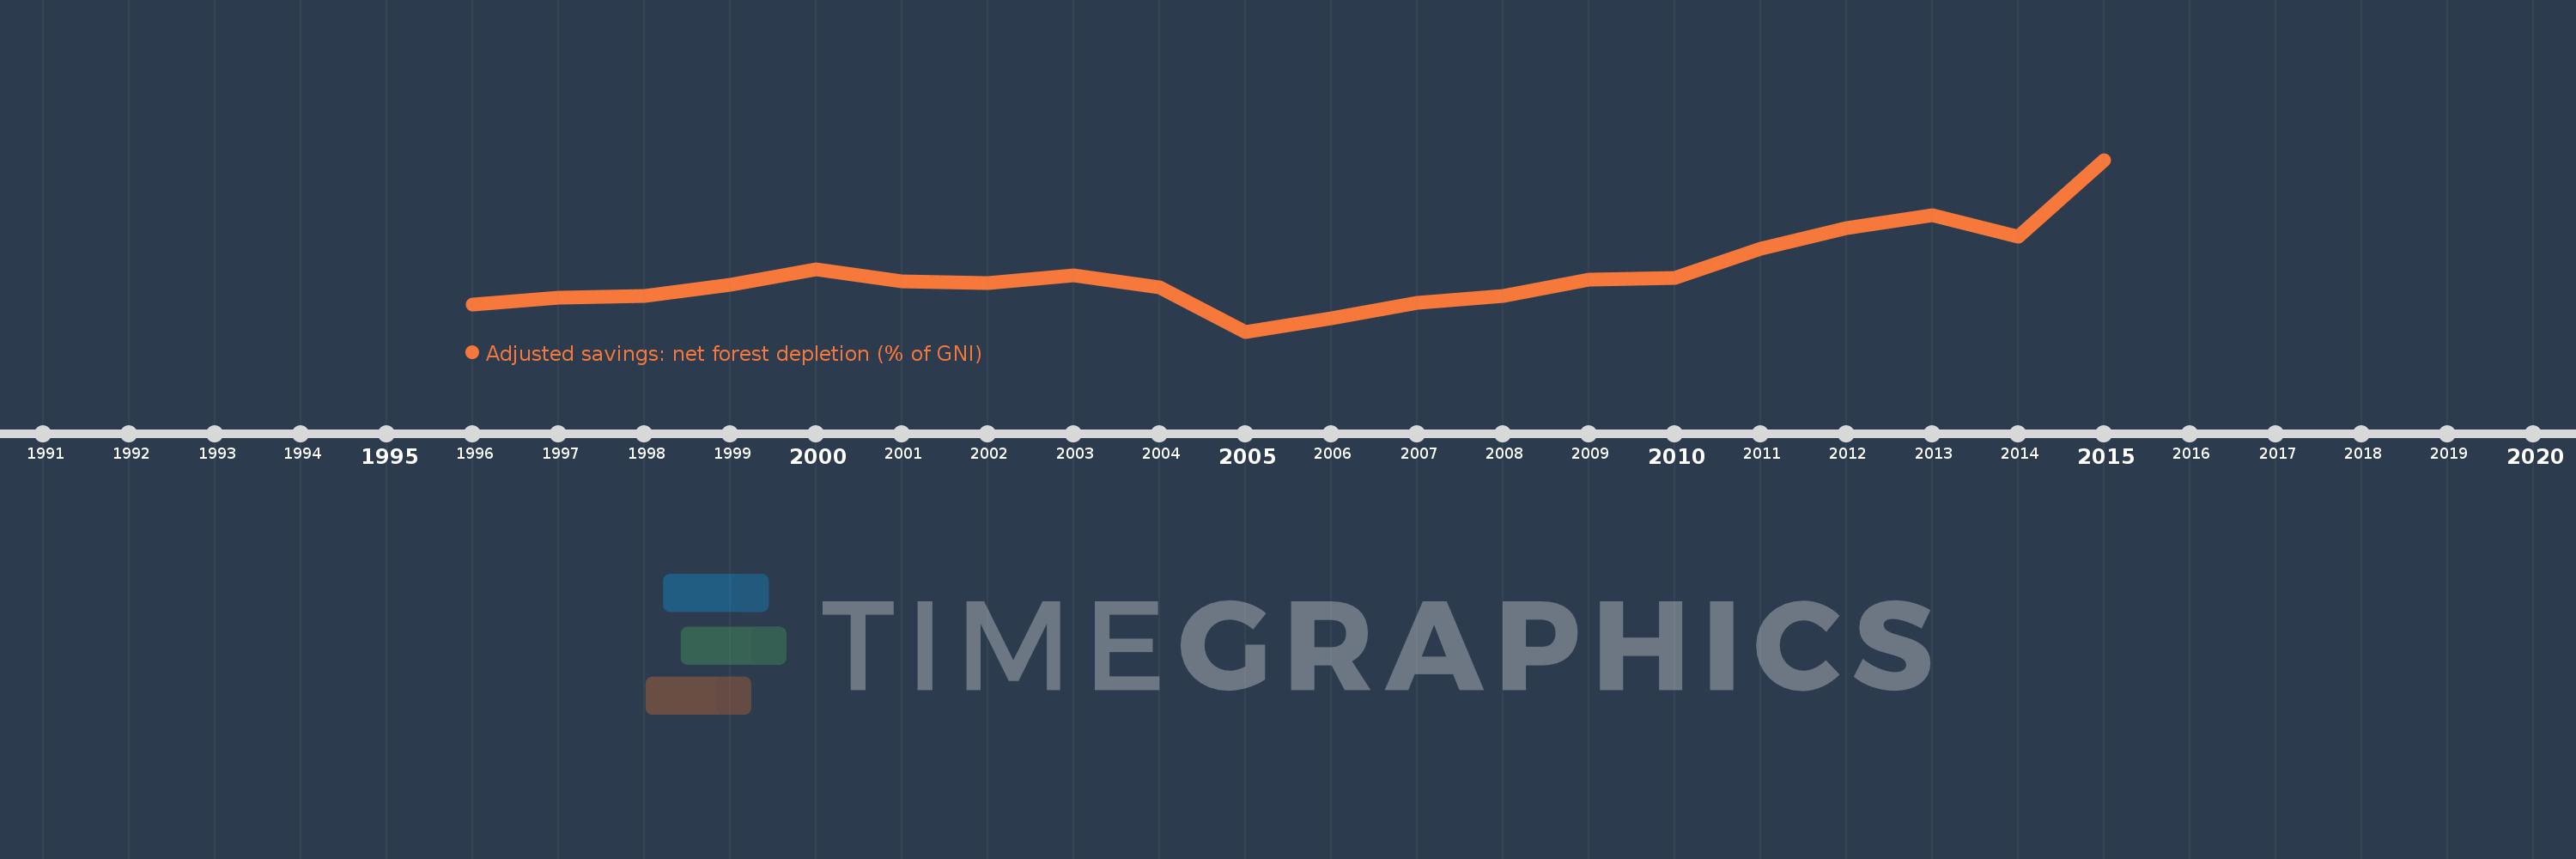
This timeline shows a graph from 1996 to 2015 of Croatia. No data until 1995. Number of actual observations by date: 20.
Source name:
World Development Indicators
Source organization:
World Bank staff estimates based on sources and methods in World Bank's "The Changing Wealth of Nations: Measuring Sustainable Development in the New Millennium" (2011).
Categories, topics:
Economy & Growth, Environment
Last updated:
apr 23, 2017
Indicators value changes by year
Meaning:
0.572
Minimum:
0.32
jan 1, 2005
Maximum:
1.068
jan 1, 2015
At the date of observation
Value
Absolute change
Change from the previous value
jan 1, 1996
0.436
+0.436
0.0%
jan 1, 1997
0.466
+0.03
6.87%
jan 1, 1998
0.477
+0.011
2.32%
jan 1, 1999
0.523
+0.046
9.71%
jan 1, 2000
0.59
+0.067
12.76%
jan 1, 2001
0.537
-0.053
-8.97%
jan 1, 2002
0.53
-0.007
-1.31%
jan 1, 2003
0.566
+0.036
6.81%
jan 1, 2004
0.511
-0.055
-9.76%
jan 1, 2005
0.32
-0.191
-37.31%
jan 1, 2006
0.377
+0.057
17.65%
jan 1, 2007
0.445
+0.069
18.2%
jan 1, 2008
0.476
+0.031
6.94%
jan 1, 2009
0.547
+0.07
14.8%
jan 1, 2010
0.552
+0.006
1.02%
jan 1, 2011
0.682
+0.13
23.54%
jan 1, 2012
0.772
+0.089
13.06%
jan 1, 2013
0.827
+0.056
7.24%
jan 1, 2014
0.732
-0.095
-11.53%
jan 1, 2015
1.068
+0.336
45.93%
Ranking of countries by current statistics by years