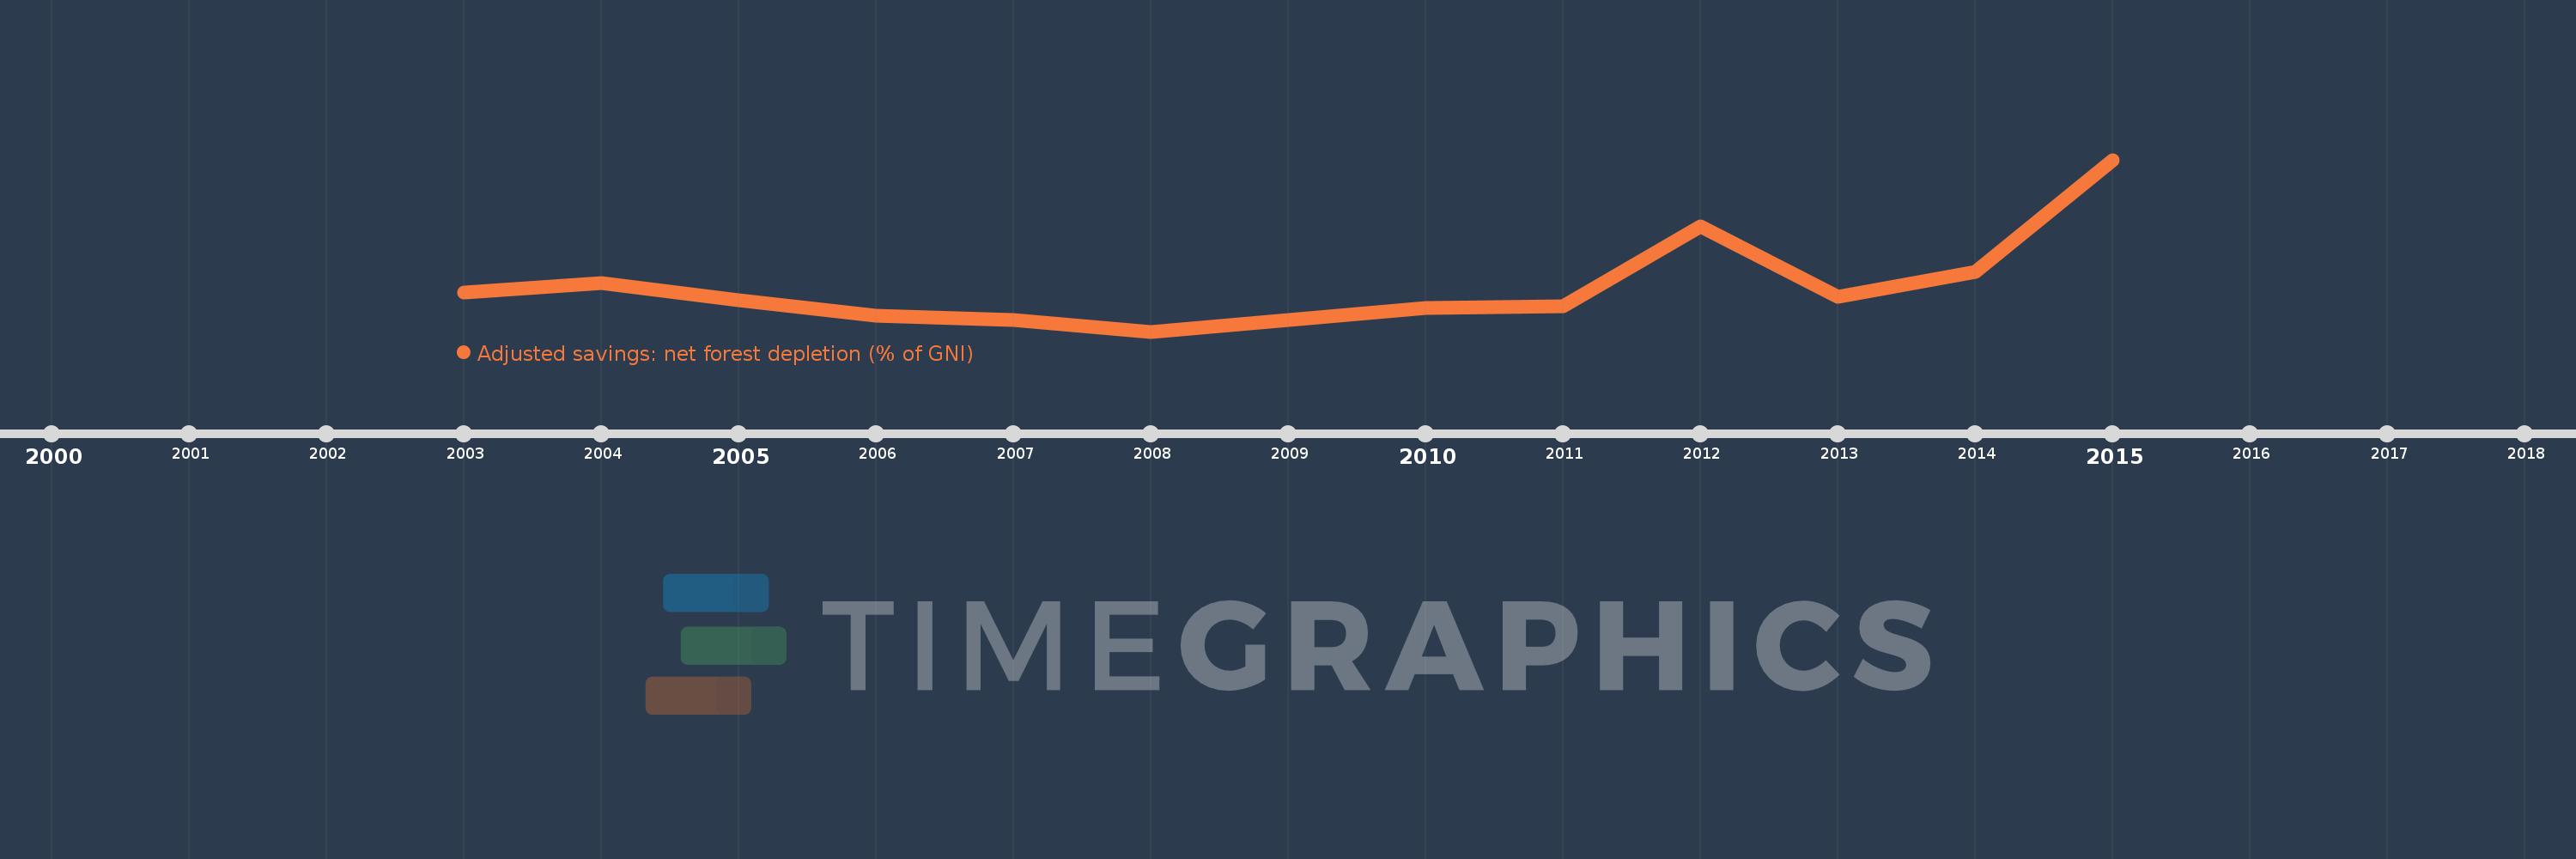
This timeline shows a graph from 2003 to 2015 of Libya. No data until 2002. Number of actual observations by date: 13.
Source name:
World Development Indicators
Source organization:
World Bank staff estimates based on sources and methods in World Bank's "The Changing Wealth of Nations: Measuring Sustainable Development in the New Millennium" (2011).
Categories, topics:
Economy & Growth, Environment
Last updated:
apr 23, 2017
Indicators value changes by year
Meaning:
0.109
Minimum:
0.035
jan 1, 2008
Maximum:
0.323
jan 1, 2015
At the date of observation
Value
Absolute change
Change from the previous value
jan 1, 2003
0.101
+0.101
0.0%
jan 1, 2004
0.116
+0.015
15.14%
jan 1, 2005
0.087
-0.028
-24.51%
jan 1, 2006
0.061
-0.027
-30.67%
jan 1, 2007
0.055
-0.006
-9.21%
jan 1, 2008
0.035
-0.02
-37.08%
jan 1, 2009
0.054
+0.02
57.38%
jan 1, 2010
0.075
+0.02
37.36%
jan 1, 2011
0.077
+0.002
2.31%
jan 1, 2012
0.211
+0.134
175.54%
jan 1, 2013
0.094
-0.117
-55.56%
jan 1, 2014
0.135
+0.042
44.33%
jan 1, 2015
0.323
+0.188
139.16%
Ranking of countries by current statistics by years