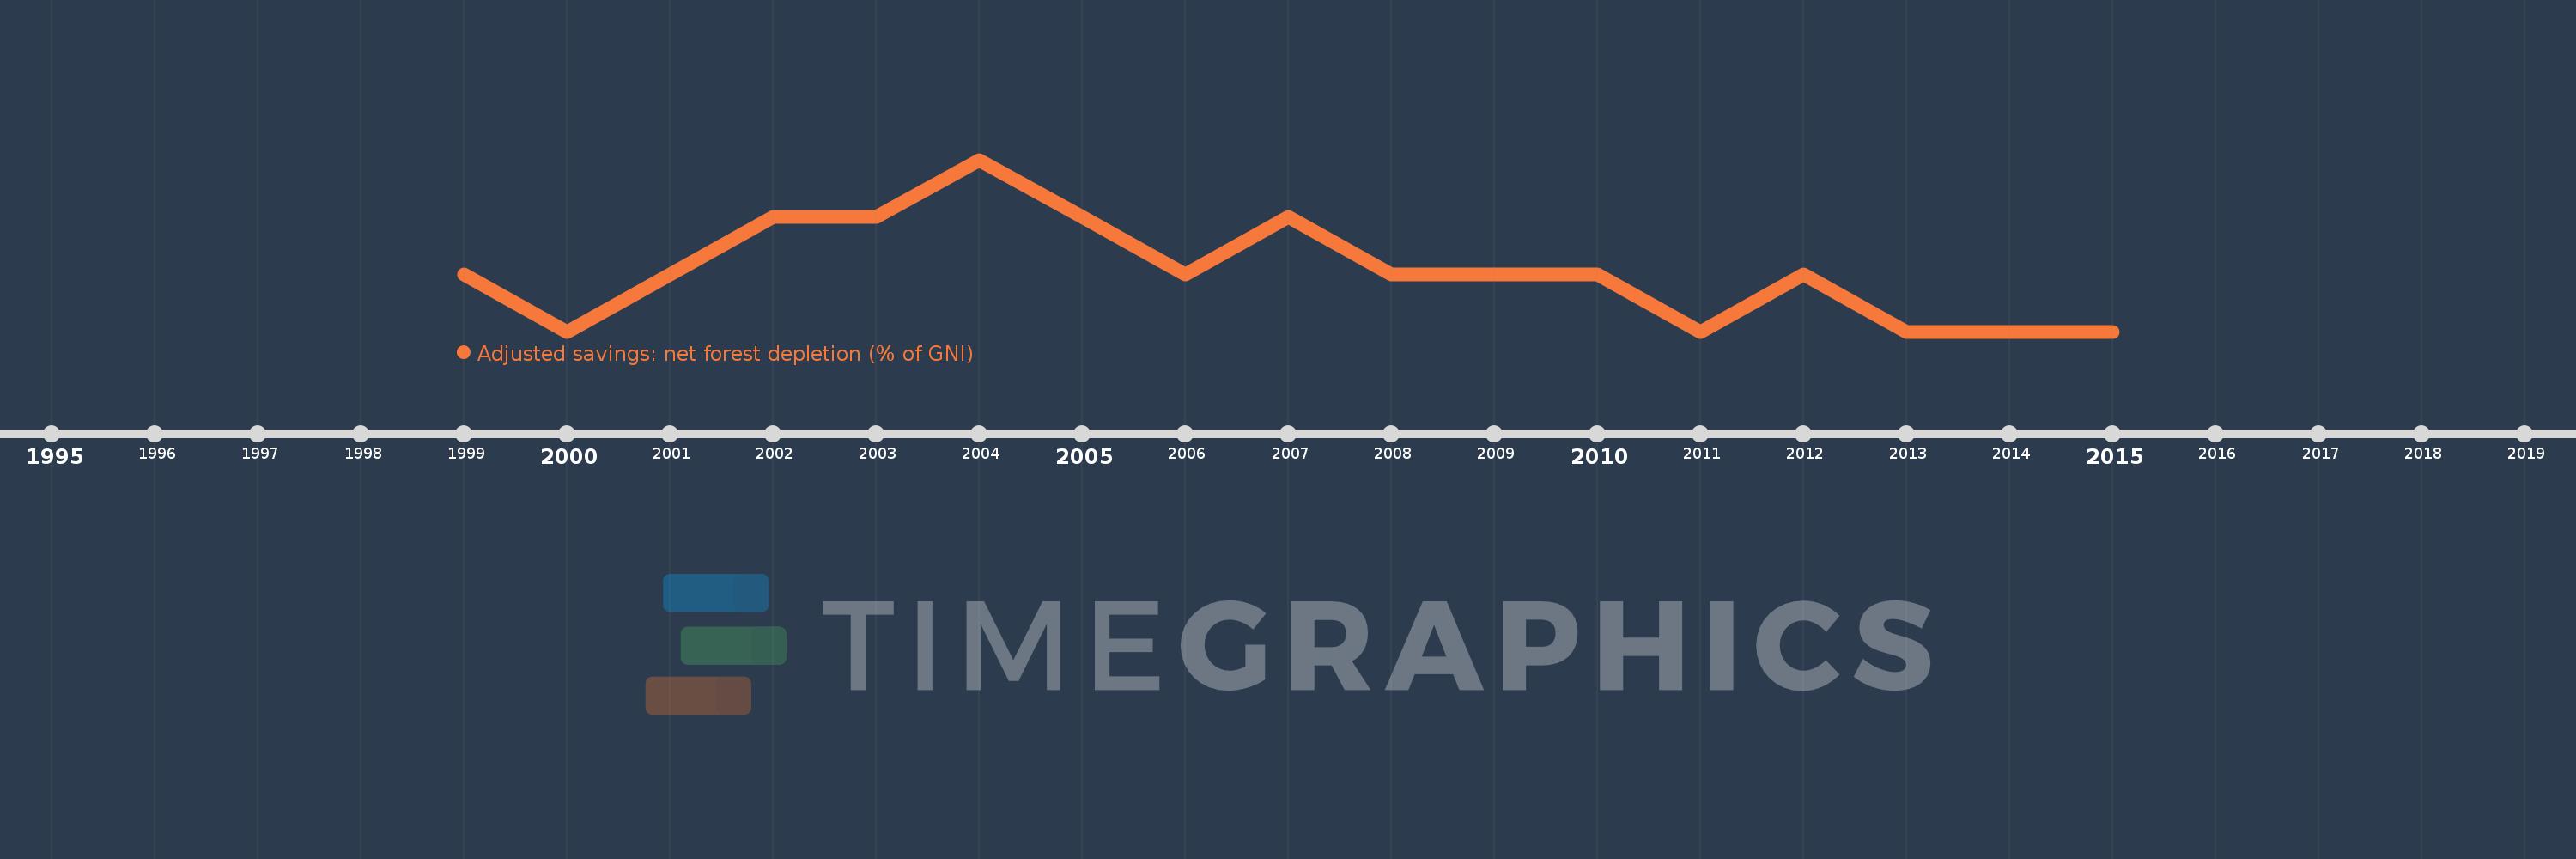
This timeline shows a graph from 1999 to 2015 of Uzbekistan. No data until 1998. Number of actual observations by date: 17.
Source name:
World Development Indicators
Source organization:
World Bank staff estimates based on sources and methods in World Bank's "The Changing Wealth of Nations: Measuring Sustainable Development in the New Millennium" (2011).
Categories, topics:
Economy & Growth, Environment
Last updated:
apr 23, 2017
Indicators value changes by year
Meaning:
0.003
Minimum:
0.002
jan 1, 2015
Maximum:
0.005
jan 1, 2004
At the date of observation
Value
Absolute change
Change from the previous value
jan 1, 1999
0.003
+0.003
0.0%
jan 1, 2000
0.002
-0.001
-36.61%
jan 1, 2001
0.003
+0.0
19.26%
jan 1, 2002
0.004
+0.001
55.8%
jan 1, 2003
0.004
+0.0
4.07%
jan 1, 2004
0.005
+0.0
10.14%
jan 1, 2005
0.004
-0.001
-19.2%
jan 1, 2006
0.003
0.0
-9.9%
jan 1, 2007
0.004
+0.0
12.54%
jan 1, 2008
0.003
-0.001
-13.93%
jan 1, 2009
0.003
0.0
-8.91%
jan 1, 2010
0.003
0.0
-1.3%
jan 1, 2011
0.002
-0.001
-33.69%
jan 1, 2012
0.003
+0.001
34.34%
jan 1, 2013
0.002
-0.001
-20.73%
jan 1, 2014
0.002
+0.0
0.28%
jan 1, 2015
0.002
0.0
-11.38%
Ranking of countries by current statistics by years